Whenever a patch is landed on autoland, it will run many builds and tests to make sure there are no regressions. Unfortunately many times we find a regression and 99% of the time backout the changes so they can be fixed. This work is done by the Sheriff team at Mozilla- they monitor the trees and when something is wrong, they work to fix it (sometimes by a quick fix, usually by a backout). A quick fact, there were 1228 regressions in H1 (January-June) 2019.
My goal in writing is not to recommend change, but instead to start conversations and figure out what data we should be collecting in order to have data driven discussions. Only then would I expect that recommendations for changes would come forth.
What got me started in looking at regressions was trying to answer a question: “How many regressions did X catch?” This alone is a tough question, instead I think the question should be “If we were not running X, how many regressions would our end users see?” This is a much different question and has two distinct parts:
Unique Regressions: Only look at regressions found that only X found, not found on both X and Y
Product Fixes: did the regression result in changing code that we ship to users? (i.e. not editing the test)
Final Fix: many times a patch [set] lands and is backed out multiple times, in this case do we look at each time it was backed out, or only the change from initial landing to final landing?
These can be more difficult to answer. For example, Product Fixes- maybe by editing the test case we are preventing a regression in the future because the test is more accurate.
In addition we need to understand how accurate the data we are using is. As the sheriffs do a great job, they are human and humans make judgement calls. In this case once a job is marked as “fixed_by_commit”, then we cannot go back in and edit it, so a typo or bad data will result in incorrect data. To add to it, often times multiple patches are backed out at the same time, so is it correct to say that changes from bug A and bug B should be considered?
This year I have looked at this data many times to answer:
This data is important to harvest because if we were to turn off a set of jobs or run them as tier-2 we would end up missing regressions. But if all we miss is editing manifests to disable failing tests, then we are getting no value from the test jobs- so it is important to look at what the regression outcome was.
In fact every time I did this I would run an active-data-recipe (fbc recipe in my repo) and have a large pile of data I needed to sort through and manually check. I spent some time every day for a few weeks looking at regressions and now I have looked at 700 (bugs/changesets). I found that in manually checking regressions, the end results fell into buckets:
test
196
28.00%
product
272
38.86%
manifest
134
19.14%
unknown
48
6.86%
backout
27
3.86%
infra
23
3.29%
Keep in mind that many of the changes which end up in mozilla-central are not only product bugs, but infrastructure bugs, test editing, etc.
After looking at many of these bugs, I found that ~80% of the time things are straightforward (single patch [set] landed, backed out once, relanded with clear comments). Data I would like to have easily available via a query:
Files that are changed between backout and relanding (even if it is a new patch).
A reason as part of phabricator that when we reland, it is required to have a few pre canned fields
Ideally this set of data would exist for not only backouts, but for anything that is landed to fix a regression (linting, build, manifest, typo).
Last week it seemed that all our limited resource machines were perpetually backlogged. I wrote yesterday to provide insight into what we run and some of our limitations. This post will be discussing the Android phones backlog last week specifically.
The Android phones are hosted at Bitbar and we split them into pools (battery testing, unit testing, perf testing) with perf testing being the majority of the devices.
There were 6 fixes made which resulted in significant wins:
Recovered offline devices at Bitbar
Restarting host machines to fix intermittent connection issues at Bitbar
Update Taskcluster generic-worker startup script to consume superceded jobs
Rewrite the scheduling script as multi-threaded and utilize bitbar APIs more efficiently
Turned off duplicate jobs that were on by accident last month
Removed old taskcluster-worker devices
On top of this there are 3 future wins that could be done to help future proof this:
upgrade android phones from 8.0 -> 9.0 for more stability
Enable power testing on generic usb hubs rather than special hubs which require dedicated devices.
merge all separate pools together to maximize device utilization
With the fixes in place, we are able to keep up with normal load and expect that future spikes in jobs will be shorter lived, instead of lasting an entire week.
Recovered offline devices at Bitbar
Every day a 2-5 devices are offline for some period of time. The Bitbar team finds some on their own and resets the devices, sometimes we notice them and ask for the devices
to be reset. In many cases the devices are hung or have trouble on a reboot (motivation for upgrading to 9.0). I will add to this that the week prior things started getting sideways and it was a holiday week for many, so less people were watching things and more devices ended up in various states.
In total we have 40 pixel2 devices in the perf pool (and 37 Motorola G5 devices as well) and 60 pixel2 devices when including the unittest and battery pools. We found that 19 devices were not accepting jobs and needed attention Monday July 8th. For planning purposes it is assumed that 10% of the devices will be offline, in this case we had 1/3 of our devices offline and we were doing merge day with a lot of big pushes running all the jobs.
Restarting host machines to fix intermittent connection issues at Bitbar
At Bitbar we have a host machine with 4 or more docker containers running and each docker container runs Linux with the Taskcluster generic-worker and the tools to run test jobs. Each docker container is also mapped directly to a phone. The host machines are rarely rebooted and maintained, and we noticed a few instances where the docker containers had trouble connecting to the network. A fix for this was to update the kernel and schedule periodic reboots.
Update Taskcluter generic-worker startup script
When the job is superseded, we would shut down the Taskcluster generic-worker, the docker image, and clean up. Previously it would terminate the job and docker container and then wait for another job to show up (often a 5-20 minute cycle). With the changes made Taskcluster generic-worker will just restart (not docker container) and quickly pick up the next job.
Rewrite the scheduling script as multi-threaded
This was a big area of improvement that was made. As our jobs increased in volume and had a wider range of runtimes, our tool for scheduling was iterating through the queue and devices and calling the APIs at Bitbar to spin up a worker and hand off a task. This is something that takes a few seconds per job or device and with 100 devices it could take 10+ minutes to come around and schedule a new job on a device. With changes made last week ( Bug 1563377 ) we now have jobs starting quickly <10 seconds, which greatly increases our device utilization.
Turn off duplicate opt jobs and only run PGO jobs
In reviewing what was run by default per push and on try, a big oversight was discovered. When we turned PGO on for Android, all the perf jobs were scheduled both for opt and PGO, when they should have been only scheduled for PGO. This was an easy fix and cut a large portion of the load down (Bug 1565644)
Removed old taskcluster-worker devices
Earlier this year we switched to Taskcluster generic-worker and in the transition had to split devices between the old taskcluster-worker and the new generic-worker (think of downstream branches). Now everything is run on generic-worker, but we had 4 devices still configured with taskcluster-worker sitting idle.
Given all of these changes, we will still have backlogs that on a bad day could take 12+ hours to schedule try tasks, but we feel confident with the current load we have that most of the time jobs will be started in a reasonable time window and worse case we will catch up every day.
A caveat to the last statement, we are enabling webrender reftests on android and this will increase the load by a couple devices/day. Any additional tests that we schedule or large series of try pushes will cause us to hit the tipping point. I suspect buying more devices will resolve many complaints about lag and backlogs. Waiting for 2 more weeks would be my recommendation to see if these changes made have a measurable change on our backlog. While we wait it would be good to have agreement on what is an acceptable backlog and when we cross that threshold regularly that we can quickly determine the number of devices needed to fix our problem.
Many times each week I see a ping on IRC or Slack asking “why are my jobs not starting on my try push?” I want to talk about why we have backlogs and some things to consider in regards to fixing the problem.
It a frustrating experience when you have code that you are working on or ready to land and some test jobs have been waiting for hours to run. I personally experienced this the last 2 weeks while trying to uplift some test only changes to esr68 and I would get results the next day. In fact many of us on our team joke that we work weekends and less during the week in order to get try results in a reasonable time.
It would be a good time to cover briefly what we run and where we run it, to understand some of the variables.
In general we run on 4 primary platforms:
Linux: Ubuntu 16.04
OSX: 10.14.5
Windows: 7 (32 bit) + 10 (v1803) + 10 (aarch64)
Android: Emulator v7.0, hardware 7.0/8.0
In addition to the platforms, we often run tests in a variety of configs:
In some cases a single test can run >90 times for a given change when iterated through all the different platforms and configurations. Every week we are adding many new tests to the system and it seems that every month we are changing configurations somehow.
In total for January 1st to June 30th (first half of this year) Mozilla ran>25M test jobs. In order to do that, we need a lot of machines, here is what we have:
linux
unittests are in AWS – basically unlimited
perf tests in data center with 200 machines – 1M jobs this year
Windows
unittests are in AWS – some require instances with a dedicated GPU and that is a limited pool)
perf tests in data center with 600 machines – 1.5M jobs this year
Windows 10 aarch64 – 35 laptops (at Bitbar) that run all unittests and perftests, a new platform in 2019 and 20K jobs this year
Windows 10 perf reference (low end) laptop – 16 laptops (at Bitbar) that run select perf tests, 30K jobs this year
OSX
unittests and perf tests run in data center with 450 mac minis – 380K jobs this year
Android
Emulators (packet.net fixed pool of 50 hosts w/4 instances/host) 493K jobs this year – run most unittests on here
will have much larger pool in the near future
real devices – we have 100 real devices (at Bitbar) – 40 Motorola – G5’s, 60 Google Pixel2’s running all perf tests and some unittests- 288K jobs this year
You will notice that OSX, some windows laptops, and android phones are a limited resource and we need to be careful for what we run on them and ensure our machines and devices are running at full capacity.
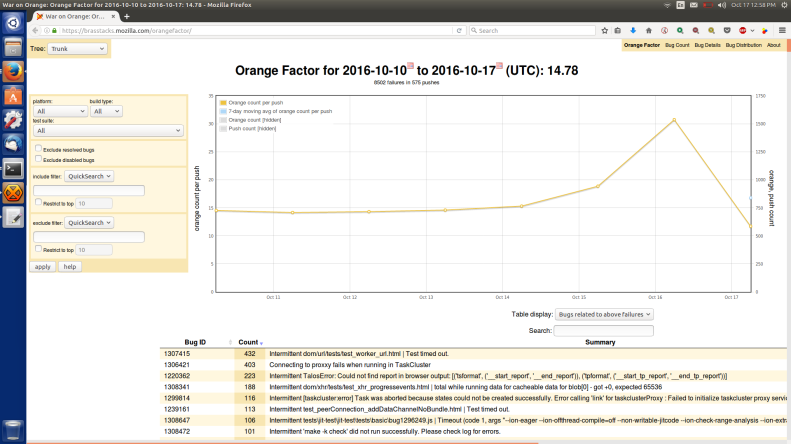
These limited resource machines are where we see jobs scheduled and not starting for a long time. We call this backlog, it could also be referred to as lag. While it would be great to point to a public graph showing our backlog, we don’t have great resources that are uniform between all machine types. Here is a view of what we have internally for the Android devices:
What typically happens when a developer pushes their code to a try server to run all the tests, many jobs finish in a reasonable amount of time, but jobs scheduled on resource constrained hardware (such as android phones) typically have a larger lag which then results in frustration.
How do we manage the load:
reduce the number of jobs
ensure tooling and infrastructure is efficient and fully operational
I would like to talk about how to reduce the number of jobs. This is really important when dealing with limited resources, but we shouldn’t ignore this on all platforms. The things to tweak are:
what tests are run and on what branches
what frequency we run the tests at
what gets scheduled on try server pushes
I find that for 1, we want to run everything everywhere if possible, this isn’t possible, so one of our tricks is to run things on mozilla-central (the branch we ship nightlies off of) and not on our integration branches. A side effect here is a regression isn’t seen for a longer period of time and finding a root cause can be more difficult. One recent fix was when PGO was enabled for android we were running both regular tests and PGO tests at the same time for all revisions- we only ship PGO and only need to test PGO, the jobs were cut in half with a simple fix.
Looking at 2, the frequency is something else. Many tests are for information or comparison only, not for tracking per commit. Running most tests once/day or even once/week will give a signal while our most diverse and effective tests are running more frequently.
The last option 3 is where all developers have a chance to spoil the fun for everyone else. One thing is different for try pushes, they are scheduled on the same test machines as our release and integration branches, except they are put in a separate queue to run which is priority 2. Basically if any new jobs get scheduled on an integration branch, the next available devices will pick those up and your try push will have to wait until all integration jobs for that device are finished. This keeps our trees open more frequently (if we have 50 commits with no tests run, we could be backing out changes from 12 hours ago which maybe was released or maybe has bitrot while performing the backout). One other aspect of this is we have >10K jobs one could possibly run while scheduling a try push and knowing what to run is hard. Many developers know what to run and some over schedule, either out of difficulty in job selection or being overly cautious.
Keeping all of this in mind, I often see many pushes to our try server scheduling what looks to be way too many jobs on hardware. Once someone does this, everybody else who wants to get their 3 jobs run have to wait in line behind the queue of jobs (many times 1000+) which often only get ran during night for North America.
I would encourage developers pushing to try to really question if they need all jobs, or just a sample of the possible jobs. With tools like |/.mach try fuzzy|, |./mach try chooser| , or |./mach try empty| it is easier to schedule what you need instead of blanket commands that run everything. I also encourage everyone to cancel old try pushes if a second try push has been performed to fix errors from the first try push- that alone saves a lot of unnecessary jobs from running.
Last November we released Firefox v.57, otherwise known as Firefox Quantum. Quantum was in many ways a whole new browser with the focus on speed as compared to previous versions of Firefox.
As I write about many topics on my blog which are typically related to my current work at Mozilla, I haven’t written about measuring or monitoring Performance in a while. Now that we are almost a year out I thought it would be nice to look at a few of the key performance tests that were important for tracking in the Quantum release and what they look like today.
First I will look at the benchmark Speedometer which was used to track browser performance primarily of the JS engine and DOM. For this test, we measure the final score produced, so the higher the number the better:
You can see a large jump in April, that is when we upgraded the hardware we run the tests on, otherwise we have only improved since last year!
Next I want to look at our startup time test (ts_paint) which measure time to launch the browser from a command line in ms, in this case lower is better:
Here again, you can see the hardware upgrade in April, overall we have made this slightly better over the last year!
What is more interesting is a page load test. This is always an interesting test and there are many opinions about the right way to do this. How we do pageload is to record a page and replay it with mitmproxy. Lucky for us (thanks to neglect) we have not upgraded our pageset so we can really compare the same page load from last year to today.
For our pages we initially setup, we have 4 pages we recorded and have continued to test, all of these are measured in ms so lower is better.
Amazon.com (measuring time to first non blank paint):
We see our hardware upgrade in April, otherwise small improvements over the last year!
Facebook (logged in with a test user account, measuring time to first non blank paint):
Again, we have the hardware upgrade in April, and overall we have seen a few other improvements
Google (custom hero element on search results):
Here you can see that what we had a year ago, we were better, but a few ups and downs, overall we are not seeing gains, nor wins (and yes, the hardware upgrade is seen in April).
Youtube (measuring first non blank paint):
As you can see here, there wasn’t a big change in April with the hardware upgrade, but in the last 2 months we see some noticeable improvements!
In summary, none of our tests have shown regressions. Does this mean that Firefox v.63 (currently on Beta) is faster than Firefox Quantum release of last year? I think the graphs here show that is true, but your mileage may vary. It does help that we are testing the same tests (not changed) over time so we can really compare apples to apples. There have been changes in the browser and updates to tools to support other features including some browser preferences that change. We have found that we don’t necessarily measure real world experiences, but we get a good idea if we have made things significantly better or worse.
Some examples of how this might be different for you than what we measure in automation:
We test in an isolated environment (custom prefs, fresh profile, no network to use, no other apps)
Outdated pages that we load have most likely changed in the last year
What we measure as a startup time or a page loaded time might not reflect what a user perceives as accurate
3.5 years ago we implemented and integrated SETA. This has a net effect today of reducing our load between 60-70%. SETA works on the premise of identifying specific test jobs that find real regressions and marking them as high priority. While this logic is not perfect, it proves a great savings of test resources while not adding a large burden to our sheriffs.
There are a two things we could improve upon:
a test job that finds a failure runs dozens if not hundreds of tests, even though the job failed for only a single test that found a failure.
in jobs that are split to run in multiple chunks, it is likely that tests failing in chunk 1 could be run in chunk X in the future- therefore making this less reliable
I did an experiment in June (was PTO and busy on migrating a lot of tests in July/August) where I did some queries on the treeherder database to find the actual test cases that caused the failures instead of only the job names. I came up with a list of 171 tests that we needed to run and these ran in 6 jobs in the tree using 147 minutes of CPU time.
This was a fun project and it gives some insight into what a future could look like. The future I envision is picking high priority tests via SETA and using code coverage to find additional tests to run. There are a few caveats which make this tough:
Not all failures we find are related to a single test- we have shutdown leaks, hangs, CI and tooling/harness changes, etc. This experiment only covers tests that we could specify in a manifest file (about 75% of the failures)
My experiment didn’t load balance on all configs. SETA does a great job of picking the fewest jobs possibly by knowing if a failure is windows specific we can run on windows and not schedule on linux/osx/android. My experiment was to see if we could run tests, but right now we have no way to schedule a list of test files and specify which configs to run them on. Of course we can limit this to run “all these tests” on “this list of configs”. Running 147 minutes of execution on 27 different configs doesn’t save us much, it might take more time than what we currently do.
It was difficult to get the unique test failures. I had to do a series of queries on the treeherder data, then parse it up, then adjust a lot of the SETA aggregation/reduction code- finally getting a list of tests- this would require a few days of work to sort out if we wanted to go this route and we would need to figure out what to do with the other 25% of failures.
The only way to run is using per-test style used for test-verify (and the in-progress per-test code coverage). This has a problem of changing the way we report tests in the treeherder UI- it is hard to know what we ran and didn’t run and to summarize between bugs for failures could be interesting- we need a better story for running tests and reporting them without caring about chunks and test harnesses (for example see my running tests by component experiment)
Assuming this was implemented- this model would need to be tightly integrated into the sheriffing and developer workflow. For developers, if you just want to run xpcshell tests, what does that mean for what you see on your try push? For sheriffs, if there is a new failure, can we backfill it and find which commit caused the problem? Can we easily retrigger the failed test?
I realized I did this work and never documented it. I would be excited to see progress made towards running a more simplified set of tests, ideally reducing our current load by 75% or more while keeping our quality levels high.
If you have the task to create automated tests for websites you will most likely make use of Selenium when it comes to testing UI interactions. To execute the tests for the various browsers out there each browser vendor offers a so called driver package which has to be used by Selenium to run each of the commands. In case of Firefox this will be geckodriver.
Within the last months we got a couple of issues reported for geckodriver that Firefox sometimes crashes while the tests are running. This feedback is great, and we always appreciate because it helps us to make Firefox more stable and secure for our users. But to actually being able to fix the crash we would need some more data, which was a bit hard to retrieve in the past.
As first step I worked on the Firefox crash reporter support for geckodriver and we got it enabled in the 0.19.0 release. While this was fine and the crash reporter created minidump files for each of the crashes in the temporarily created user profile for Firefox, this data gets also removed together with the profile once the test has been finished. So copying the data out of the profile was impossible.
As of now I haven’t had the time to improve the user experience here, but I hope to be able to do it soon. The necessary work which already got started will be covered on bug 1433495. Once the patch on that bug has been landed and a new geckodriver version released, the environment variable “MINIDUMP_SAVE_PATH” can be used to specify a target location for the minidump files. Then geckodriver will automatically copy the files to this target folder before the user profile gets removed.
But until that happened a bit of manual work is necessary. Because I had to mention those steps a couple of time and I don’t want to repeat that in the near future again and again, I decided to put up a documentation in how to analyze the crash data, and how to send the data to us. The documentation can be found at:
Over the years we have had great dreams of running our tests in many different ways. There was a dream of ‘hyperchunking’ where we would run everything in hundreds of chunks finishing in just a couple of minutes for all the tests. This idea is difficult for many reasons, so we shifted to ‘run-by-manifest’, while we sort of do this now for mochitest, we don’t for web-platform-tests, reftest, or xpcshell. Both of these models require work on how we schedule and report data which isn’t too hard to solve, but does require a lot of additional work and supporting 2 models in parallel for some time.
In recent times, there has been an ongoing conversation about ‘run-by-component’. Let me explain. We have all files in tree mapped to bugzilla components. In fact almost all manifests have a clean list of tests that map to the same component. Why not schedule, run, and report our tests on the same bugzilla component?
I got excited near the end of the Austin work week as I started working on this to see what would happen.
This is hand crafted to show top level productions, and when we expand those products you can see all the components:
I just used the first 3 letters of each component until there was a conflict, then I hand edited exceptions.
What is great here is we can easy schedule networking only tests:
and what you would see is:
^ keep in mind in this example I am using the same push, but just filtering- but I did test on a smaller scale for a bit with just Core-networking until I got it working.
What would we use this for:
collecting code coverage on components instead of random chunks which will give us the ability to recommend tests to run with more accuracy than we have now
developers can filter in treeherder on their specific components and see how green they are, etc.
easier backfilling of intermittents for sheriffs as tests are not moving around between chunks every time we add/remove a test
While I am excited about the 4 reasons above, this is far from being production ready. There are a few things we would need to solve:
My current patch takes a list of manifests associated with bugzilla components are runs all manifests related to that component- we would need to sanitize all manifests to only have tests related to one component (or solve this differently)
My current patch iterates through all possible test types- this is grossly inefficient, but the best I could do with mozharness- I suspect a slight bit of work and I could have reftest/xpcshell working, likewise web-platform tests. Ideally we would run all tests from a source checkout and use |./mach test <component>| and it would find what needs to run
What do we do when we need to chunk certain components? Right now I hack on taskcluster to duplicate a ‘component’ test for each component in a .json file; we also cannot specify specific platform specific features and lose a lot of the functionality that we gain with taskcluster; I assume some simple thought and a feature or two would allow for us to retain all the features of taskcluster with the simplicity of component based scheduling
We would need a concrete method for defining the list of components (#2 solves this for the harnesses). Currently I add raw .json into the taskcluster decision task since it wouldn’t find the file I had checked into the tree when I pushed to try. In addition, finding the right code names and mappings would ideally be automatic, but might need to be a manual process.
when we run tests in parallel, they will have to be different ‘platforms’ such as linux64-qr, linux64-noe10s. This is much easier in the land of taskcluster, but a shift from how we currently do things.
This is something I wanted to bring visibility to- many see this as the next stage of how we test at Mozilla, I am glad for tools like taskcluster, mozharness, and common mozbase libraries (especially manifestparser) which have made this a simple hack. There is still a lot to learn here, we do see a lot of value going here, but are looking for value and not for dangers- what problems do you see with this approach?
When you are using Selenium and geckodriver to automate your tests in Firefox you might see a behavior change with Firefox 58 when using the commands Element Click or Element Send Keys. For both commands we have enabled the interactability checks by default now. That means that if such an operation has to be performed for any kind of element it will be checked first, if a click on it or sending keys to it would work from a normal user perspective at all. If not a not-interactable error will be thrown.
If you are asking now why this change was necessary, the answer is that we are more WebDriver specification conformant now.
While pushing this change out by default, we are aware of corner cases where we accidentally might throw such a not-interactability error, or falsely assume the element is interactable. If you are hitting such a condition it would be fantastic to let us know about it as best by filing an geckodriver issue with all the required information so that it is reproducible for us.
In case the problem causes issues for your test suites, but you totally want to use Firefox 58, you can use the capability moz:webdriverClick and turn off those checks. Simply set it to False, and the former behavior will happen. But please note that this workaround will only work for Firefox 58, and maybe Firefox 59, because then the old and legacy behavior will be removed.
That’s why please let us know about misbehavior when using Firefox 58, so that we have enough time to get it fixed for Firefox 59, or even 58.
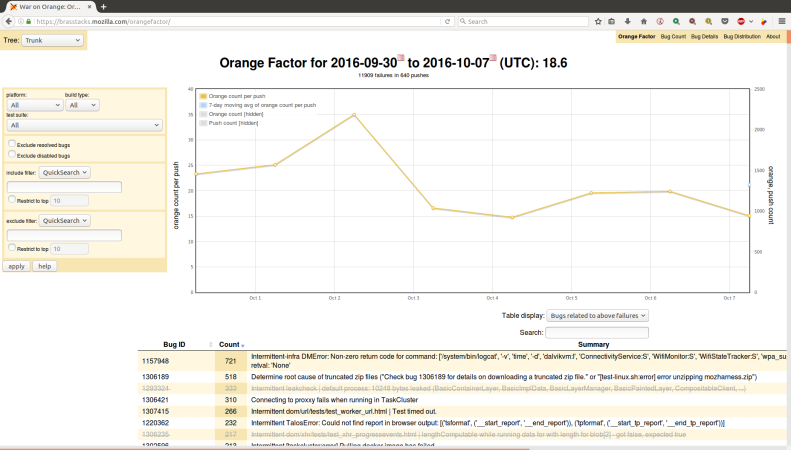
Often I hear about our talos results, why are they so noisy? What is noise in this context- by noise we are referring to a larger stddev in the results we track, here would be an example:
With the large spread of values posted regularly for this series, it is hard to track improvements or regressions unless they are larger or very obvious.
Knowing the definition of noise, there are a few questions that we often need to answer:
Developers working on new tests- what is the level of noise, how to reduce it, what is acceptable
Over time noise changes- this causes false alerts, often not related to to code changes or easily discovered via infra changes
New hardware we are considering- is this hardware going to post reliable data for us.
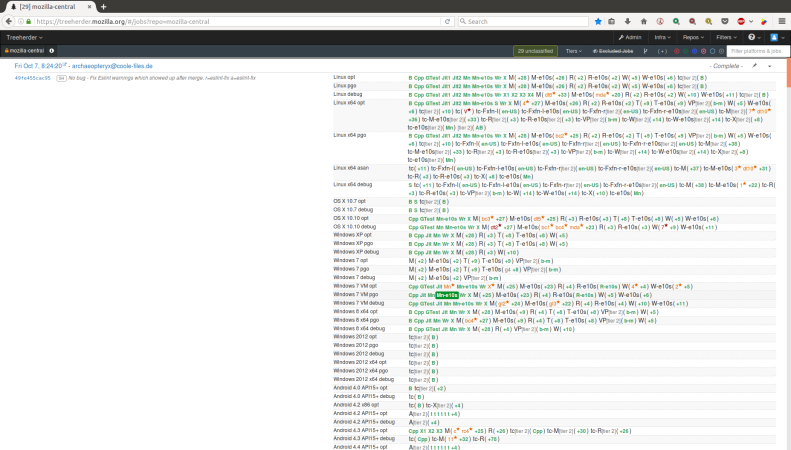
What I care about is the last point, we are working on replacing the hardware we run performance tests on from old 7 year old machines to new machines! Typically when running tests on a new configuration, we want to make sure it is reliably producing results. For our system, we look for all green:
This is really promising- if we could have all our tests this “green”, developers would be happy. The catch here is these are performance tests, are the results we collect and post to graphs useful? Another way to ask this is are the results noisy?
To answer this is hard, first we have to know how noisy things are prior to the test. As mentioned 2 weeks ago, Talos collects 624 metrics that we track for every push. That would be a lot of graph and calculating. One method to do this is push to try with a single build and collect many data points for each test. You can see that in the image showing the all green results.
One method to see the noise, is to look at compare view. This is the view that we use when comparing one push to another push when we have multiple data points. This typically highlights the changes that are easy to detect with our t-test for alert generation. If we look at the above referenced push and compare it to itself, we have:
Here you can see for a11y, linux64 has +- 5.27 stddev. You can see some metrics are higher and others are lower. What if we add up all the stddev numbers that exist, what would we have? In fact if we treat this as a sum of the squares to calculate the variance, we can generate a number, in this case 64.48! That is the noise for that specific run.
Now if we are bringing up a new hardware platform, we can collect a series of data points on the old hardware and repeat this on the new hardware, now we can compare data between the two:
What is interesting here is we can see side by side the differences in noise as well as the improvements and regressions. What about the variance? I wanted to track that and did, but realized I needed to track the variance by platform, as each platform could be different- In bug 1416347, I set out to add a Noise Metric to the compare view. This is on treeherder staging, probably next week in production. Here is what you will see:
Here we see that the old hardware has a noise of 30.83 and the new hardware a noise of 64.48. While there are a lot of small details to iron out, while we work on getting new hardware for linux64, windows7, and windows10, we now have a simpler method for measuring the stability of our data.
Over the last 6 months there has been a deep focus on performance in order to release Firefox 57. Hundreds of developers sought out performance improvements and after thousands of small adjustments we see massive improvements.
Last week I introduced Ionut who has come in as a Performance Sheriff. What do we do on a regular basis when it comes to monitoring performance. In the past I focused on Talos and how many bugs per release we found, fixed, and closed. While that is fun and interesting, we have expanded the scope of sheriffing.
Currently we have many frameworks:
Talos (old fashioned perf testing, in-tree, per commit, all desktop platforms- startup, benchmarks, pageload)
build_metrics (compile time, installer size, sccache hit rate, num_constructors, etc.)
AWSY (are we slim yet, now in-tree, per commit, measuring memory during heavy pageload activity)
Autophone (android fennec startup + talos tests, running on 4 different phones, per commit)
Platform Microbenchmarks (developer written GTEST (cpp code), mostly graphics and stylo specific)
We continue to refine benchmarks and tests on each of these frameworks to ensure we are running on relevant configurations, measuring the right things, and not duplicating data unnecessarily.
Looking at the list of frameworks, we collect 1127 unique data points and alert on them with included bugs for anything sustained and valid. While the number of unique metrics can change, here are the current number of metrics we track:
Framework
Total Metrics
Talos
624
Autophone
19
Build Metrics
172
AWSY
83
Platform Microbenchmarks
229
1127
While we generate these metrics for every commit (or every few commits for load reasons), what happens is we detect a regression and generate an alert. In fact we have a sizable number of alerts in the last 6 weeks:
Framework
Total Alerts
Talos
429
Autophone
77
Build Metrics
264
AWSY
85
Platform Microbenchmarks
227
1082
Alerts are not really what we file bugs on, instead we have an alert summary when can (and typically) does contain a set of alerts. Here is the total number of alert summaries (i.e. what a sheriff will look at):
Framework
Total Summaries
Talos
172
Autophone
54
Build Metrics
79
AWSY
29
Platform Microbenchmarks
136
470
These alert summaries are then mapped into bugs (or downstream alerts to where the alerts started). Here is a breakdown of the bugs we have:
Framework
Total Bugs
Talos
41
Autophone
3
Build Metrics
17
AWSY
6
Platform Microbenchmarks
6
73
This indicates there are 73 bugs associated with Performance Summaries . What is deceptive here is many of those bugs are ‘improvements’ and not ‘regressions’. If you figured it out, we do associate improvements with bugs and try to comment in the bugs to let you know of the impact your code has on a [set of] metric[s].
Framework
Total Bugs
Talos
23
Autophone
3
Build Metrics
14
AWSY
4
Platform Microbenchmarks
3
47
This is a much smaller number of bugs- now there are a few quirks here-
some regressions show up across multiple frameworks (reduces to 43 total)
some bugs that are ‘downstream’ are marked against the root cause instead of just being downstream. Often this happens when we are sheriffing bugs and a downstream alert shows up a couple days later.
Over the last few releases here are the tracking bugs:
Note that Firefox 58 has 28 bugs associated with it, but we have 43 bugs from the above query. Some of those bugs from the above query are related to Firefox 57, and some are starred against a duplicate bug or a root cause bug instead of the regression bug.
I hope you find this data useful and informative towards understanding what goes on with all the performance data.
I gave an update 2 weeks ago on the current state of Stockwell (intermittent failures). I mentioned additional posts were coming and this is a second post in the series.
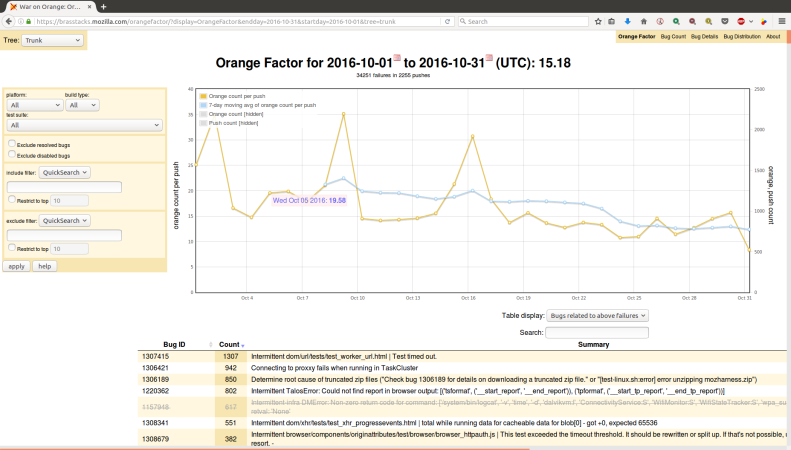
First off the tree sheriffs who maintain merges between branches, tree closures, backouts, hot fixes, and a many other actions that keep us releasing code do one important task, and that is star failures to a corresponding bug.
These annotations are saved in Treeherder and Orange Factor. Inside of Orange Factor, we have a robot that comments on bugs– this has been changing a bit more frequently this year to help meet our new triage needs.
Once we get bugs annotated, now we work on triaging them. Our primarily tool is Neglected Oranges which gives us a view of all failures that meet our threshold and don’t have a human comment in the last 7 days. Here is the next stage of the process:
As you can see this is very simple, and it should be simple. The ideal state is adding more information to the bug which helps make it easier for the person we NI? to prioritize the bug and make a decision:
While there is a lot more we can do, and much more that we have done, this seems to be the most effective use when looking across 1000+ bugs that we have triaged so far this year.
In some cases a bug fails very frequently and there are no development resources to spend fixing the bug- these will sometimes cross our 200 failures in 30 days policy and will get a [stockwell disabled-recommended] whiteboard tag, we monitor this and work to disable bugs on a regular basis:
This isn’t as cut and dry as disable every bug, but we do disable as quickly as possible and push hard on the bugs that are not as trivial to disable.
There are many new people working on Intermittent Triage and having a clear understanding of what they are doing will help you know how a random bug ended up with a ni? to you!
About 8 months ago we started looking for a full time performance sheriff to help out with our growing number of alerts and needs for keeping the Talos toolchain relevant.
We got really lucky and ended up finding Ionut (:igoldan on irc, #perf). Over the last 6 months, Ionut has done a fabulous job of learning how to understand Talos alerts, graphs, scheduling, and narrowing down root causes. In fact, he has not only been able to easily handle all of the Talos alerts, Ionut has picked up alerts from Autophone (Android devices), Build Metrics (build times, installer sizes, etc.), AWSY (memory metrics), and Platform Microbenchmarks (tests run inside of gtest written by a few developers on the graphics and stylo teams).
While I could probably write a list of Ionut’s accomplishments and some tricky bugs he has sorted out, I figured your enjoyment of reading this blog is better spend on getting to know Ionut better, so I did a Q&A with him so we can all learn much more about Ionut.
Tell us about where you live?
I live in Iasi. It is a gorgeous and colorful town, somewhere in the North-East of Romania. It is full of great places and enchanting sunsets. I love how a casual walk
leads me to new, beautiful and peaceful neighborhoods.
I have many things I very much appreciate about this town:
the people here, its continuous growth, its historical resonance, the fact that its streets once echoed the steps of the most important cultural figures of our country. It also resembles ancient Rome, as it is also built on 7 hills.
It’s pretty hard not to act like a poet around here.
What inspired you to be a computer programmer?
I wouldn’t say I was inspired to be a programmer.
During my last years in high school, I occasionally consulted with my close ones. Each time we concluded that IT is just the best domain to specialize in: it will improve continuously, there will be jobs available; things that are evident nowadays.
I found much inspiration in this domain after the first year in college, when I noticed the huge advances and how they’re conducted. I understood we’re living in a whole new era. Digital transformation is now the coined term for what’s going on.
Any interesting projects you have done in the past (school/work/fun)?
I had the great opportunity to work with brilliant teams on a full advertising platform, from almost scratch.
It got almost everything: it was distributed, highly scalable, completely written in
Python 3.X, the frontend adopted material design, NoSQL database in conjunction with SQL ones… It used some really cutting-edge libraries and it was a fantastic feeling.
Now it’s Firefox. The sound name speaks for itself and there are just so many cool things I can do here.
What hobbies do you have?
I like reading a lot. History and software technology are my favourite subjects.
I enjoy cooking, when I have the time. My favourite dish definitely is the Hungarian goulash.
Also, I enjoy listening to classical music.
If you could solve any massive problem, what would you solve?
Greed. Laziness. Selfishness. Pride.
We can resolve all problems we can possibly encounter by leveraging technology.
Keeping non-values like those mentioned above would ruin every possible achievement.
Where do you see yourself in 10 years?
In a peaceful home, being a happy and caring father, spending time and energy with
my loved ones. Always trying to be the best example for them. I envision becoming a top notch professional programmer, leading highly performant teams on
sound projects. Always familiar with cutting-edge tech and looking to fit it in our tool set.
Constantly inspiring values among my colleagues.
Do you have any advice or lessons learned for new students studying computer science?
Be passionate about IT technologies. Always be curious and willing to learn about new things. There are tons and tons of very good videos, articles, blogs, newsletters, books, docs…Look them out. Make use of them. Follow their guidance and advice.
Continuous learning is something very specific for IT. By persevering, this will become your second nature.
Treat every project as a fantastic opportunity to apply related knowledge you’ve acquired. You need tons of coding to properly solidify all that theory, to really understand why you need to stick to the Open/Closed principle and all other nitty-gritty little things like that.
I have really enjoyed getting to know Ionut and working with him. If you see him on IRC please ping him and say hi
When a bug for an intermittent test failure needs attention, who should be contacted? Who is responsible for fixing that bug? For as long as I have been at Mozilla, I have heard people ask variations of this question, and I have never heard a clear answer.
There are at least two problematic approaches that are sometimes suggested:
The test author: Many test authors are no longer active contributors. Even if they are still active at Mozilla, they may not have modified the test or worked on the associated project for years. Also, making test authors responsible for their tests in perpetuity may dissuade many contributors from writing tests at all!
The last person to modify the test: Many failing tests have been modified recently, so the last person to modify the test may be well-informed about the test and may be in the best position to fix it. But recent changes may be trivial and tangential to the test. And if the test hasn’t been modified recently, this option may revert to the test author, or someone else who isn’t actively working in the area or is no longer familiar with the code.
There are at least two seemingly viable approaches:
“You broke it, you fix it”: The person who authored the changeset that initiated the intermittent test failure must fix the intermittent test failure, or back out their change.
The module owner for the module associated with the test is responsible for the test and must find someone to fix the intermittent test failure, or disable the test.
Let’s have a closer look at these options.
The “you broke it, you fix it” model is appealing because it is a continuation of a principle we accept whenever we check in code: If your change immediately breaks tests or is otherwise obviously faulty, you expect to have your change backed out unless you can provide an immediate fix. If your change causes an intermittent failure, why should it be treated differently? The sheriffs might not immediately associate the intermittent failure with your change, but with time, most frequent intermittent failures can be traced back to the associated changeset, by repeating the test on a range of changesets. Once this relationship between changeset and failure is determined, the changeset needs to be fixed or backed out.
A problem with “you broke it, you fix it” is that it is sometimes difficult and/or time-consuming to find the changeset that started the intermittent. The less frequent the intermittent, the more tests need to be backfilled and repeated before a statistically significant number of test passes can be accepted as evidence that the test is passing reliably. That takes time, test resources, etc.
Sometimes, even when that changeset is identified, it’s hard to see a connection between the change and the failing test. Was the test always faulty, but just happened to pass until a patch modified the timing or memory layout or something like that? That’s a possibility that always comes to mind when the connection between changeset and failing test is less than obvious.
Finally, if the changeset author is not invested in the test, or not familiar with the importance of the test, they may be more inclined to simply skip the test or mark it as failing.
The “module owner” approach is appealing because it reinforces the Mozilla module owner system: Tests are just code, and the code belongs to a module with a responsible owner. Practically, ‘mach file-info bugzilla-component <test-path>’ can quickly determine the bugzilla component, and nearly all bugzilla components now have triage owners (who are hopefully approved by the module owner and knowledgeable about the module).
Module and triage owners ought to be more familiar with the failing test and the features under test than others, especially people who normally work on other modules. They may have a greater interest in properly fixing a test than someone who has only come to the test because their changeset triggered an intermittent failure.
Also, intermittent failures are often indicative of faulty tests: A “good” test passes when the feature under test is working, and it fails when the feature is broken. An intermittently failing test suggests the test is not reliable, so the test’s module owner should be ultimately responsible for improving the test. (But sometimes the feature under test is unreliable, or is made unreliable by a fault in another feature or module.)
A risk I see with the module owner approach is that it potentially shifts responsibility away from those who are introducing problems: If my patch is good enough to avoid immediate backout, any intermittent test failures I cause in other people’s modules is no longer my concern.
As part of the Stockwell project, :jmaher and I have been using a hybrid approach to find developers to work on frequent intermittent test failure bugs. We regularly triage, using tools like OrangeFactor to identify the most troublesome intermittent failures and then try to find someone to work on those bugs. I often use a procedure like this:
Does hg history show the test was modified just before it started failing? Ping the author of the patch that updated the test.
Can I retrigger the test a reasonable number of times to track down the changeset associated with the start of the failures? Ping the changeset author.
Does hg history indicate significant recent changes to the test by one person? Ask that person if they will look at the test, since they are familiar with it.
If all else fails, ping the triage owner.
This triage procedure has been a great learning experience for me, and I think it has helped move lots of bugs toward resolution sooner, reducing the number of intermittent failures we all need to deal with, but this doesn’t seem like a sustainable mode of operation. Retriggering to find the regression can be especially time consuming and is sometimes not successful. We sometimes have 50 or more frequent intermittent failure bugs to deal with, we have limited time for triage, and while we are bisecting, the test is failing.
I’d much prefer a simple way of determining an owner for problematic intermittents…but I wonder if that’s realistic. While I am frustrated by the times I’ve tracked down a regressing changeset only to find that the author feels they are not responsible, I have also been delighted to find changeset authors who seem to immediately see the problem with their patch. Test authors sometimes step up with genuine concern for “their” test. And triage owners sometimes know, for instance, that a feature is obsolete and the test should be disabled. So there seems to be some value in all these approaches to finding an owner for intermittent failures…and none of the options are perfect.
When a bug for an intermittent test failure needs attention, who should be contacted? Who is responsible for fixing that bug? Sorry, no clear answer here either! Do you have a better answer? Let me know!
Hello from Dublin! Yesterday I had the privilege of attending KatsConf2, a functional programming conference put on by the fun-loving, welcoming, and crazy-well-organized @FunctionalKats. It was a whirlwind of really exciting talks from some of the best speakers around. Here’s a glimpse into what I learned.
There’s no such thing as an objectively perfect programming language: all languages make tradeoffs. But it is possible to find/design a language that’s more perfect for you and your project’s needs.
I took a bunch of notes during the talks, in case you’re hungering for more details. But @jessitron took amazing graphical notes that I’ve linked to in the talks below, so just go read those!
And for the complete experience, check out this storify Vicky Twomey-Lee, who led a great ally skills workshop the evening before the conference, made of the #KatsConf2 tweets:
<noscript>[<a href="http://storify.com/whykay/kats-conf-2" target="_blank">View the story "Kats Conf 2" on Storify</a>]</noscript>
Hopefully this gives you an idea of what was said and which brain-exploding things you should go look up now! Personally it opened up a bunch of cans of worms for me - definitely a lot of the material went over my head, but I have a ton of stuff to go find out more (i.e. the first thing) about.
Disclaimer: The (unedited!!!) notes below represent my initial impressions of the content of these talks, jotted down as I listened. They may or may not be totally accurate, or precisely/adequately represent what the speakers said or think, and the code examples are almost certainly mistake-ridden. Read at your own risk!
The origin story of FunctionalKats
FunctionalKatas => FunctionalKats => (as of today) FunctionalKubs
Meetups in Dublin & other locations
Katas for solving programming problems in different functional languages
Talks about FP and related topics
Welcome to all, including beginners
The Perfect Language
Bodil Stokke @bodil
Bodil's opinions on the Perfect Language. #katsConf2 Rather noninflammatory, it must be early in the morning https://t.co/KsqGAKubpd
What would the perfect programming language look like?
“MS Excel!”
“Nobody wants to say ‘JavaScript’ as a joke?”
“Lisp!”
“I know there are Clojurians in the audience, they’re suspiciously silent…”
There’s no such thing as the perfect language; Languages are about compromise.
What the perfect language actually is is a personal thing.
I get paid to make whatever products I feel like to make life better for programmers. So I thought: I should design the perfect language.
What do I want in a language?
It should be hard to make mistakes
On that note let’s talk about JavaScript.
It was designed to be easy to get into, and not to place too many restrictions on what you can do.
But this means it’s easy to make mistakes & get unexpected results (cf. crazy stuff that happens when you add different things in JS).
By restricting the types of inputs/outputs (see TypeScript), we can throw errors for incorrect input types - error messages may look like the compiler yelling at you, but really they’re saving you a bunch of work later on by telling you up front.
Let’s look at PureScript
Category theory!
Semiring: something like addition/multiplication that has commutativity (a+b == b+a).
Semigroup: …?
There should be no ambiguity
1 + 2 * 3
vs.
(+ 1 (* 2 3))
Pony: 1 + (2 * 3) – have to use parentheses to make precedence explicit
It shouldn’t make you think
Joe made a language at Ericsson in the late 80’s called “Erlang”. This is a gif of Joe from the Erlang movie. He’s my favorite movie star.
Immutability: In Erlang, values and variable bindings never change. At all.
This takes away some cognitive overhead (because we don’t have to think about what value a variable has at the moment)
Erlang tends to essentially fold over state: the old state is an input to the function and the new state is an output.
The “abstraction ceiling”
This term has to do with being able to express abstractions in your language.
Those of you who don’t know C: you don’t know what you’re missing, and I urge you not to find out.
If garbage collection is a thing you don’t have to worry about in your language, that’s fantastic.
Elm doesn’t really let you abstract over the fact that e.g. map over array, list, set is somehow the same type of operation. So you have to provide 3 different variants of a function that can be mapped over any of the 3 types of collections.
This is a bit awkward, but Elm programmers tend not to mind, because there’s a tradeoff: the fact that you can’t do this makes the type system simple so that Elm programmers get succinct, helpful error messages from the compiler.
I was learning Rust recently and I wanted to be able to express this abstraction. If you have a Collection trait, you can express that you take in a Collection and return a Collection. But you can’t specify that the output Collection has to be the same type as the incoming one. Rust doesn’t have this ability to deal with this, but they’re trying to add it.
We can do this in Haskell, because we have functors. And that’s the last time I’m going to use a term from category theory, I promise.
On the other hand, in a language like Lisp you can use its metaprogramming capabilities to raise the abstraction ceiling in other ways.
Efficiency
I have a colleague and when I suggested using OCaml as an implementation language for our utopian language, she rejected it because it was 50% slower than C.
In slower languages like Python or Ruby you tend to have performance-critical code written in the lower-level language of C.
But my feeling is that in theory, we should be able to take a language like Haskell and build a smarter compiler that can be more efficient.
But the problem is that we’re designing languages that are built on the lambda calculus and so on, but the machines they’re implemented on are not built on that idea, but rather on the Von Neumann architecture. The computer has to do a lot of contortions to take the beautiful lambda calculus idea and convert it into something that can run on an architecture designed from very different principles. This obviously complicates writing a performant and high-level language.
Rust wanted to provide a language as high-level as possible, but with zero-cost abstractions. So instead of garbage collection, Rust has a type-system-assisted kind of clean up. This is easier to deal with than the C version.
If you want persistent data structures a la Erlang or Clojure, they can be pretty efficient, but simple mutation is always going to be more efficient. We couldn’t do PDSs natively.
Suppose you have a langauge that’s low-level enough to have zero-cost abstractions, but you can plug in something like garbage collection, currying, perhaps extend the type system, so that you can write high-level programs using that functionality, but it’s not actually part of the library. I have no idea how to do this but it would be really cool.
Summing up
You need to think about:
Ergonomics
Abstraction
Efficiency
Tooling (often forgotten at first, but very important!)
Community (Code sharing, Documentation, Education, Marketing)
Your language has to be open source. You can make a proprietary language, and you can make it succeed if you throw enough money at it, but even the successful historical examples of that were eventually open-sourced, which enabled their continued use. I could give a whole other talk about open source.
Functional programming & static typing for server-side web
Oskar Wickström @owickstrom
FP has been influencing JavaScript a lot in the last few years. You have ES6 functional features, libraries like Underscore, Rambda, etc, products like React with FP/FRP at their core, JS as a compile target for functional languages
But the focus is still client-side JS.
Single page applications: using the browser to write apps more like you wrote desktop apps before. Not the same model as perhaps the web browser was intended for at the beginning.
Lots of frameworks to choose from: Angular, Ember, Meteor, React&al. Without JS on the client, you get nothing.
There’s been talk recently of “isomorphic” applications: one framework which runs exactly the same way on the esrver and the client. The term is sort of stolen & not used in the same way as in category theory.
Static typing would be really useful for Middleware, which is a common abstraction but every easy to mess up if dynamically typed. In Clojure if you mess up the middleware you get the Stack Trace of Doom.
Let’s use extensible records in PureScript - shout out to Edwin’s talk related to this. That inspired me to implement this in PureScript, which started this project called Hyper which is what I’m working on right now in my free time.
Goals:
Safe HTTP middleware architecture
Make effects of middleware explicit
No magic
How?
Track middleware effects in type system
leverage extensible records in PureScript
Provide a common API for middleware
Write middleware that can work on multiple backends
Design
Conn: sort of like in Elixer, instead of passing a request and returning a response, pass them all together as a single unit
Middleware: a function that takes a connection c and returns another connection type c’ inside another type m
Indexed monads: similar to a state monad, but with two additional parameters: the type of the state before this action, and the type after. We can use this to prohibit effectful operations which aren’t correct.
Response state transitions: Hyper uses phantom types to track the state of response, guaranteeing correctness in response side effects
Someone said this is like “refactoring in reverse”
Generalization: introduce parameters instead of constant values
Induction: prove something for a base case and a first step, and you’ve proven it for all numbers
Induction hypothesis: if you are at step n, you must have been at step n-1 before that.
With these elements, we have a program! We just make an if/else: e.g. for sum(n), if n == 0: return 0; else return sum(n-1) + n
It all comes down to writing the right specification: which is where we need to step away from the keyboard and think.
Induction is the basis of recursion.
We can use induction to create a specification for sorting lists from which we can derive the QuickSort algorithm.
But we get 2 sorting algorithms for the price of 1: if we place a restriction that we can only do one recursive call, we can tweak the specification to derive InsertionSort, thus proving that Insertion Sort is a special case of Quick Sort.
I stole this from a PhD dissertation (“Functional Program Derivation” by ). This is all based on program derivation work by Djikstra.
Takeaways:
Programming == Math. Practicing some basic math is going to help you write code, even if you won’t be doing these kind of exercises on yo ur day-to-day
Calculations provide insight
Delay choices where possible. Say “let’s assume a solution to this part of the problem” and then go back and solve it later.
I’m writing a whole book on this, if you’re interested in giving feedback on chapter drafts let me know! mail at felienne dot com
Q&A:
is there a link between the specification and the complexity of the program? Yes, the specification has implications for implementation. The choices you make within the specification (e.g. caching values, splitting computation) affect the efficency of the program.
What about proof assistants? Those are nice if you’re writing a dissertation or whatnot, but if you’re at the stage where you’re practicing this, the exercise is being precise, so I recommend doing this on paper. The second your fingers touch the keyboard, you can outsource your preciseness to the computer.
Once you’ve got your specification, how do you ensure that your program meets it? One of the things you could do is write the spec in something like fscheck, or you could convert the specification into tests. Testing and specification are really enriching each other. Writing tests as a way to test your specification is also a good way to go. You should also have some cases for which you know, or have an intuition of, the behavior. But none of this is supposed to go in a machine, it’s supposed to be on paper.
The cake and eating it: or writing expressive high-level programs that generate fast low-level code at runtime
Nada Amin @nadamin
Distinguish stages of computation
Program generator: basic types (Int, String, T) are executed at code generation time
Rep(Int), Rep(String), Rep(T) are left as variables in the generated code and executed at program run time(?)
Shonan Challenge for Generative Programming - part of the gen. pro. for HPC literature: you want to generate code that is specialized to a particular matrix
Demo of generating code to solve this challenge
Generative Programming Patterns
Deep linguistic reuse
Turning interpreters into compilers
You can think of the process of staging as something which generates code, think of an interpreter as taking code and additional input and creates a result.
Putting them together we get something that takes code and symbolic input, and in the interpret stage generates code which takes actual input, which in the execution stage produces a result
This idea dates back to 1971, Futamura’s Partial Evaluation
Generating efficient low-level code
e.g. for specialized parsers
We can take an efficient HTTP parser from 2000+ lines to 200, with parser combinators
But while this is great for performance, it leaves big security holes
So we can use independent tools to verify the generated code after the fact
Sometimes generating code is not the right solution to your problem
Rug: an External DSL for Coding Code Transformations (with Scala Parser-Combinators)
Jessica Kerr @jessitron, Atomist
The last talk was about abstraction without (performance) regret. This talk is about abstraction without the regret of making your code harder to read.
Elm is a particularly good language to modify automatically, because it’s got some boilerplate, but I love that boilerplate! No polymorphism, no type classes - I know exactly what that code is going to do! Reading it is great, but writing it can be a bit of a headache.
As a programmer I want to spend my time thinking about what the users need and what my program is supposed to do. I don’t want to spend my time going “Oh no, i forgot to put that thing there”.
Here’s a simple Elm program that prints “Hello world”. The goal is to write a program that modifies this existing Elm code and changes the greeting that we print.
We’re going to do this with Scala. The goal is to generate readable code that I can later go ahead and change. It’s more like a templating engine, but instead of starting with a templating file it starts from a cromulent Scala program.
Our goal is to parse an Elm file into a parse tree, which give us the meaningful bits of that file.
The “parser” in parser combinators is actually a combination of lexer and parser.
Reuse is dangerous, dependencies are dangerous, because they create coupling. (Controlled, automated) Cut & Paste is a safer solution.
at which point @jessitron does some crazy fast live coding to write an Elm parser in Scala
Rug is the super-cool open-source project I get to work on as my day job now! It’s a framework for creating code rewriters
In conclusion: any time my job feels easy, I think “OMG I’m doing it wrong”. But I don’t want to introduce abstraction into my code, because someone else is going to have difficulty reading that. I want to be able to abstract without sacrificing code readability. I can make my job faster and harder by automating it.
There are many programming paradigms that don’t get enough attention. The one I want to talk about today is Relational Programming. It’s somewhat representative of Logic Programming, like Prolog. I want to show you what can happen when you commit fully to the paradigm, and see where that leads us.
Functional Programming is a special case of Relational Programming, as we’re going to see in a minute.
What is functional programming about? There’s a hint in the name. It’s about functions, the idea that representing computation in the form of mathematical functions could be useful. Because you can compose functions, you don have to reason about mutable state, etc. - there are advantages to modeling computation as math. functions.
In relational programming, instead of representing computation as functions we represent it as relations. You can think of a relation in may ways. If you’re familiar with relational databases, or you can think in terms of tuples where we want to reason over sets or collections of tuples, or we can think of it in terms of algebra - like high school algebra - where we have variables representing unknown quantities and we have to figure out their values. We’ll see that we can get FP as a special case - there’s a different set of tradeoffs - but we’ll see that when you commit fully to this paradigm you can get some very surprising behavior.
Let’s start in our functional world, we’re going to write a little program in Scheme or Racket, a little program to manipulate lists. We’ll just do something simple like append or concatenate. Let’s define append in Scheme:
We’re going to use a relational programming language called Mini Kanren which is basically an extension that has been applied to lots of languages which allows us to put in variables representing values and ask Kanren to fill in those values.
So I’m going to define appendo. (By convention we define our names ending in -o, it’s kind of a long story, happy to explain offline.)
Writes a bunch of Kanren that we don’t really understand
Now I can do:
> (run 1 (q) (appendo '(a b c) '(d e) q))
((a b c d e))
So far, not very interesting, if this is all it does then it’s no better than append.
But where it gets interesting is that I can run it backwards to find an input:
> (run 1 (X) (appendo '(a, b, c) X (a b c d e)))
((d e))
Or I can ask it to find N possible inputs:
> (run 2 (X Y) (appendo X Y (a b c d e)))
((a b c d) (e))
((a b c d e) ())
Or all possible inputs:
> (run* (X Y) (appendo X Y (a b c d e)))
((a b c d) (e))
((a b c d e) ())
...
What happens if I do this?
> (run* (X Y Z) (appendo X Y Z))
It will run forever. This is sort of like a database query, except where the tables are infinite.
One program we could write is an interpreter, an evaluator. We’re going to take an eval that’s written in MiniKanren, which is called evalo and takes two arguments: the expression to be evaluated, and the value of that expression.
> (run 1 (a) (evalo '(lambda (x) x) q))
((closure x x ()))
> (run 1 (a) (evalo '(list 'a) q))
((a))
Professor wrote a Valentine's day post "99 ways to say 'I love you' in Racket", to teach people Racket by showing 99 different racket expressions that evaluate to the list `(I love you)`
What about quines: a quine is a program that evaluates to itself. How could we find or generate a quine?
> (run 1 (q) (evalo q q))
And twines: two different programs p and q where p evaluates to q and q evaluates to p.
> (run 1 (p q) (=/= p q) (evalo p q) (evalo q p))
...two expressions that basically quote/unquote themselves...
What would happen if we run Scheme’s append in our evaluator?
> (run 1 (q)
    (evalo
      `(letrec ((append
                  (lambda (l s)
                    (if (null? l)
                        s
                        (cons (car l)
                              (append (cdr l)
                                      s)))))))
          (append '(a b c) '(d e))
      q))
((a b c d e))
But we can put the variable also inside the definition of append:
> (run 1 (q)
    (evalo
      `(letrec ((append
                  (lambda (l s)
                    (if (null? l)
                        q
                        (cons (car l)
                              (append (cdr l)
                                      s)))))))
          (append '(a b c) '(d e))
      '(a b c d e)))
(s)
Now we’re starting to synthesize programs, based on specifications. When I gave this talk at PolyConf a couple of years ago Jessitron trolled me about how long it took to run this, since then we’ve gotten quite a bit faster.
This is a tool called Barliman that I (and Greg Rosenblatt) have been working on, and it’s basically a frontend, a dumb GUI to the interpreter we were just playing with. It’s just a prototype. We can see a partially specified definition - a Scheme function that’s partially defined, with metavariables that are fill-in-the-blanks for some Scheme expressions that we don’t know what they are yet. Barliman’s going to guess what the definition is going to be.
(define ,A
    (lambda ,B
      ,C))
Now we give Barliman a bunch of examples. Like (append '() '()) gives '(). It guesses what the missing expressions were based on those examples. The more test cases we give it, the better approximation of the program it guesses. With 3 examples, we can get it to correctly guess the definition of append.
Yes, you are going to lose your jobs. Well, some people are going to lose their jobs. This is actually something that concerns me, because this tool is going to get a lot better.
If you want to see the full dog & pony show, watch the ClojureConj talk I gave with Greg.
Writing the tests is indeed the harder part. But if you’re already doing TDD or property-based testing, you’re already writing the tests, why don’t you just let the computer figure out the code for you based on those tests?
Some people say this is too hard, the search space is too big. But that’s what they said about Go, and it turns out that if you use the right techniques plus a lot of computational power, Go isn’t as hard as we thought. I think in about 10-15 years program synthesis won’t be as hard as we think now. We’ll have much more powerful IDEs, much more powerful synthesis tools. It could even tell you as you’re writing your code whether it’s inconsistent with your tests.
What this will do for jobs, I don’t know. I don’t know, maybe it won’t pan out, but I can no longer tell you that this definitely won’t work. I think we’re at the point now where a lot of the academic researchers are looking at a bunch of different parts of synthesis, and no one’s really combining them, but when they do, there will be huge breakthroughs. I don’t know what it’s going to do, but it’s going to do something.
Without laziness, we waste a lot of space, because when we have recursion we have to keep allocating memory for each evaluated thing. Laziness allows us to get around that.
What is laziness, from a theoretical standpoint?
The first thing we want to talk about is different ways to evaluate expressions.
> f x y = x + y
> f (1 + 1) (2 + 2)
How do we evaluate this?
=> (1 + 1) + (2 + 2)
=> 2 + 4
=> 6
This evaluation was normal form
Church-Rosser Theorem: the order of evaluation doesn’t matter, ultimately a lambda expression will evaluate to the same thing.
But! We have things like non-termination, and termination can only be determined after the fact.
Here’s a way we can think of types: Let’s think of a Boolean as something which has three possible values: True, False, and “bottom”, which represents not-yet-determined, a computation that hasn’t ended yet. True and False are more defined than bottom (e.g. _|_ <= True). Partial ordering.
Monotone functions: if we have a function that takes a Bool and returns a Bool, and x and y are bools where x <= y, then f x <= f y. We can now show that f _|_ = True and f x = False doesn’t work out, because it would have the consequence that True => False, which doesn’t work - that’s a good thing because if it did, we would have solve the halting problem. What’s nice here is that if we write a function and evaluate it in normal order, in the lazy way, then this naturally works out.
Laziness is basically non-strictness (this normal order thing I’ve been talking about the whole time), and sharing.
Laziness lets us reuse code and use combinators. This is something I miss from Haskell when I use any other language.
Honorable mention: Purely Functional Data Structures by Chris Okasaki. When you have Persistent Data Structures, you need laziness to have this whole amortization argument going on. This book introduces its own dialect of ML (lazy ML).
How do we do laziness in Haskell (in GHC)? At an intermediate stage of compilation called STG, Haskell takes unoptimized code and optimizes it to make it lazy. (???)
Idris is a pure functional language with dependent types. It’s a “total” language, which means you have program totality: a program either terminates, or gives you new results.
Goals are:
Encourage type-driven development
Reduce the cost of writing correct software - giving you more tools to know upfront the program will do the correct thing.
People on the internet say, you can’t do X, you can’t do Y in a total language. I’m going to do X and Y in a total language.
Types become plans for a program. Define the type up front, and use it to guide writing the program.
You define the program interactively. The compiler should be less like a teacher, and more like a lab assistant. You say “let’s work on this” and it says “yes! let me help you”.
As you go, you need to refine the type and the program as necessary.
Test-driven development has “red, green, refactor”. We have “type, define, refine”.
If you care about types, you should also care about totality. You don’t have a type that completely describes your program unless your program is total.
Given f : T: if program f is total, we know that it will always give a result of type T. If it’s partial, we only know that if it gives a result, it will be type T, but it might crash, run forever, etc. and not give a result.
The difference between total and partial functions in this world: if it’s total, we can think of it as a Theorem.
Idris can tell us whether or not it thinks a program is total (though we can’t be sure, because we haven’t solved the halting problem “yet”, as a student once wrote in an assignment). If I write a program that type checks but Idris thinks it’s possibly not total, then I’ve probably done the wrong thing. So in my Idris code I can tell it that some function I’m defining should be total.
I can also tell Idris that if I can prove something that’s impossible, then I can basically deduce anything, e.g. an alt-fact about arithmetic. We have the absurd keyword.
We have Streams, where a Stream is sort of like a list without nil, so potentially infinite. As far as the runtime is concerned, this means this is lazy. Even though we have strictness.
Idris uses IO like Haskell to write interactive programs. IO is a description of actions that we expect the program to make(?). If you want to write interactive programs that loop, this stops it being total. But we can solve this by describing looping programs as a stream of IO actions. We know that the potentially-infinite loops are only going to get evaluated when we have a bit more information about what the program is going to do.
Turns out, you can use this to write servers, which run forever and accept responses, which are total. (So the people on the internet are wrong).
Check out David Turner’s paper “Elementary Strong Functional Programming”, where he argues that totality is more important than Turing-completeness, so if you have to give up one you should give up the latter.
Riding the tram you hear the word “Linux” pronounced in four different languages. Stepping out into the grey drizzle, you instantly smell fresh waffles and GitHub-sponsored coffee, and everywhere you look you see a FSF t-shirt. That’s right kids, it’s FOSDEM time again! The beer may not be free, but the software sure is.
Last year I got my first taste of this most epic of FLOSS conferences, back when I was an unemployed ex-grad-student with not even 5 pull requests to my name. This year, as a bona fide open source contributor, Mozillian, and full-time professional software engineer, I came back for more. Here are some things I learned:
Open source in general - and, anecdotally, FOSDEM in particular - has a diversity problem. (Yes, we already knew this, but it still needs mentioning.)
…But not for long, if organizations like Mozilla and projects like IncLudo have anything to say about it.
Disclaimer: The (unedited!!!) notes below represent my impressions of the content of these talks, jotted down as I listened. They may or may not be totally accurate, or precisely/adequately represent what the speakers said or think. If you want to get it from the horse’s mouth, follow the links to the FOSDEM schedule entry to find the video, slides, and/or other resources!
Limited to the content space; has no control over browser chrome
FirefoxDriver
Deprecated due to add-on signing from Ffx 48
Marionette (Woo!!!)
Introduced 2012, originally for FirefoxOS
Directly integrated into Gecko
Controls chrome and content (whereas Selenium is content-based)
GeckoDriver
Proxy for W3C WebDriver & Gecko
WebDriver spec should be a recommendation by end of Q1 2017
Idea: any browser implementing the spec can be automated
Has been adopted by all major browser vendors
Thanks to WebDriver, Selenium (or any automation client) doesn’t have to worry about how to automate all the browsers: just has to implement the spec, and can then control any compliant browser
GeckoDriver not feature complete yet, partly bc the spec is still in late stages of development
FoxPuppet
Python package w/ simple API for finding & interacting with the Firefox UI
Allows you to interact with Firefox in Selenium, builds on top of Selenium
Ultimately going to be used to test Ffx itself
Marionette can do more than what just Selenium offers (chrome); FoxPuppet takes it the next step by making it much simpler to write automation code using Selenium+Marionette
At the moment supports window management, interaction with popups, soon interaction with tabs…
No, because there’s no true headless mode for Firefox, though you can make it effectively headless via e.g. running in Docker
Can it work with WebGL?
The problem is similar to with canvas - if we just have one element, we can’t look inside of it unless there’s some workaround to expose additional information about the the state of the app specifically for testing
Excecuting async JS?
Selenium has functionality to handle this, and since FoxPuppet builds on Selenium, the base Selenium functionality is still available
Mostly research, for trying out new ideas more quickly than we could in Ffx (without worrying about putting it in front of users)
How do rendering engines work? (Using Gecko as a reference)
layout: DOM Tree layout is computed and transformed into a Frame Tree (has other names in e.g. WebKit)
invalidation: From the Frame Tree we get a display list - pretty flat structure of things we need to render
painting: We then render the display list into a Layer Tree
like layers in Photoshop
Intermediate surfaces containing rendered elements
compositing: mirror the layer tree on the compositor process, for scrolling etc. at a high frame rate
WebRender
attempts to move away from this type of architecture and do something different
designed to work around the GPU, like a game rendering engine
drops the distinction between painting/compositing, and just render everything to the window directly
take the page content & turn it into a series of primitives we can send to the GPU (??)
written in Rust
using OpenGL for now, though in the future other backends would be possible
doesn’t understand arbitrary shapes, but rather only a simple set of shapes that are common on the web (e.g. rectangles, rounded rects)
Working fast on a GPU
GPUs are very stateful things, so switching state/state changes have a big impact
Batching is the key
Transferring data to/from the CPU is expensive
Memory bandwidth is really costly, especially on mobile devices - so try to avoid touching too many pixels/touching the same pixels too many times (aka “overdraw”)
Rendering back-to-front, you have to draw e.g. the whole background even if most of it is covered by other things
Rendering front-to-back means you can avoid drawing any parts of layers other than those that will ultimately be seen
Copyright reform is happening, but unfortunately it’s not the kind of reform we need
Doesn’t focus on the interests of users on the internet
Instead of protecting & encouraging innovation & creativity online, may in some cases undermine that
Mozilla wants to ensure that the internet remains a “global public resource open & accessible to all”
not trying to get rid of copyright
but rather encourage copyright laws that support all actors in the web ecosystem
Issues in the current copyright directive
Upload filters:
platforms that are holding large amounts of copyrighted content would need agrements with rights holders
ensuring that they uphold those agreements would require them to implement upload filters that may end up restricting users’ ability to post their own content
Neighboring rights - aka “snippet tax” or “google tax”
proposal to extend copyright to press publishers
press publications would get to charge aggregators for e.g. posting a snippet of their article, the headline, and a hyperlink
already been attempted in Germany and Spain, where it had negative effects on startup aggregators and entrenched the power of established aggregators (Google)
Text & Data Mining (TDM)
there would be restrictions on ingesting copyrighted data for the purposes of data mining
there would only be exceptions for research institutions
The fight right now is unfortunately quite binary: The big Silicon Valley companies/aggregators (Google etc.) vs. the Publishing/Music/Film industry
We need it to involve the full spectrum of stakeholders on the web, especially users, independent content creators
Get involved!
changecopyright.org
raegan@mozilla.com
Series of events across Europe
Q&A:
Since filtering requires monitoring, and monitoring is unconstitutional in the EU, are there plans to fight this if it passes?
Yes, there is absolutely a contradiction there, and we plan to fight it. We want to bring the proposal in line with existing law and channel activism against these filters.
Previous events/campaigns were focused on Freedom of Panorama (copyright exception that allows you to take photographs of e.g. buildings, art and post them online). Will new events be focused on the 4 areas you discussed?
Yes, this is sort of our 2nd wave of activism on this issue, and we’ll be organizing and encouraging more advocacy around these issues.
Do you coordinate with the media?
Yes. There are a number of organizations working on a modern version of copyright that looks forward, not backwards. The C4C (copyright for creativity) brings together a lot of players (e.g libraries, digital rights NGOs), and that serves as a sort of umbrella. A lot of folks have similar issues and we work together as much as possible to amplify & support certain voices.
What is the purpose of another wave? Are we starting over?
EU policy making is a very slow game. This reform has been under discussion for over 5 years, and the process of it going through negotiations to reach a final EU parliament agreement will be at least a year. If we want to have an impact & mobilize different voices, it has to be a sustained, long-term effort, which was not the case in the 1st wave because we didn’t have the proposal yet. Now that we have it, we have more focus on what to encourage people to speak out about, which is potentially game-changing.
It seems that the education exception excludes all informal sources of education
This exception applies to cases where licensed materials can’t be acquired. But that’s not really the problem; the problem is the cost. There’s now a campaign copyrightforeducation.org. It’s something we’re following closely, and we’re mostly relying on our partners who are experts in this area.
When will this be decided by parliament?
There will be votes on committee opinions next month, but the main opinion will be deliberated in March, and they want it to be voted by end of summer 2017. So the next 6 months could be game-changing, it’s an important time to contact your representatives.
Would the TDM exception implicate privacy concerns?
This doesn’t deal with privacy-protected content, but rather would allow people that have lawfully acquired works/texts to create e.g. a visualization. It doesn’t get into privacy issues about mining people’s metadata and all that - it’s a separate issue from privacy and wouldn’t override it.
But it’s difficult to implement - “we are feeling beings who think, not thinking beings who feel”
some research suggests that our ability to reason may exist to convince others of our ideas, rather than to make decisions
IncLudo project created a variety of games to improve workplace diversity in India
some teach about biases
some (esp. board games) encourage conversation & exchange of experiences/stories among players
Process
Game jams are a good way to try out new ideas
Paper prototypes are great for experimenting, though clients don’t always accept them so easily
Having a diverse team helps
Q&A
You mentioned a game where you have to hide your bias from others
You pretend you’re management at a company, and you have to hire someone for a position. Everyone has a secret bias card (“don’t want to hire [women, muslims, …]”). Your goal is to fight for the candidate you (don’t) want, but without being so obvious about it as to reveal your secret bias to the other managers. There were some really funny conversations coming out of it.
How do you measure the impact?
That’s really hard. There’s a few different things: you can try to measure what people learned from the game, which is difficult in itself. The other attempt is to see what the organizations actually do in real live - that’s what (our partner) ZMQ is going to do: see if the orgs actually change their practices.
How do your games relate to competitive vs. collaborative games
I wouldn’t agree that competition is bad by itself - it motivates us and as long as we understand that we’re competing in the game and not once it’s over. Our games are competitive, with the exception of Pirat Partage which wasn’t competitive but then the players started asking us for a scoring system so that they could see who’s winnign
Aren’t competition and diversity contradictory?
If you’re trying to bring diversity into an existing social structure made of companies that are competing, it makes sense to sell it to them that way.
teach information literacy: critical thinking about info sources
raise awareness about open data
The game talks about process of creation of scientific knowledge
Who pays for scientific knowledge?
Unis pay Scientists’ salaries
Unis must also pay publishers, the publishers don’t pay the scientists
Unis also pay to buy the journal, to buy back the knowledge
So we say in scientific knowledge domain, people (taxpayers) pay 3 times
What keeps this system going?
each scientist has an H index based on their publications that’s important for their career
the publishers own the journals, i.e. the means for scientists to advance their careers
monopoly by big scientific publishers make knowledge less accessible
One big solution would be the open data movement
publishing not in private journals, but open source archives
but scientists often think this will strip them of their work
but it’s the other way around
This is the subject of our game: we believe in the goal of open knowledge
the goal is to raise awareness about this problem
and also that checking the sources of your info is very important
We chose to use the same humorous tone as Ace Attorney (manga-like Japanese game where you play a lawyer, trial is like Dragonball-Z)
you’re sent to investigate a massive plot linked to who owns info & data in the uni/scientific publishing world
you have one person who tells you a false assertion backed by false info sources
like in Papers Please, you need to point out what is false in the info source & link it with a publishing rule that the source is supposed to respect
What we learned
procedural rhetoric: the game itself must convey the message
a lot of educational games involve a little playing and a lot of reading
the goal here is that you actually learn by playing
making a game about notions like this that have gray areas is a lot harder than making games about hard science/math/programming etc. & needs more time invested
what should ed games aim to do?
games in general are not very good at conveying a very complex message/complex domain of learning
what they’re good at is piquing interest and raising awareness
ed games shouldn’t aim to teach everything to the player, but rather to give them the interest to go look into the topic themselves
we tried to make our game one that’s actually fun in itself
the game is for 1st year uni students, who by that point are used to playing a lot of “serious games” that are not up to the standard of entertainment games
ours aims not just to be a “serious game” for education, but one that’s actually fun to play in and of itself
The game will be released (for free) in April 2017
teachers told us: we can give a lot of lessons, but with older children the problem is motivation
so we developed a game to address that
available on Android/iOS
available in schools & counseling facilities, but we also encourage students to use it indepedently
Available in Czech, Slovak, and German language
What’s dyslexia?
specific learning disability
problems with reading/writing caused by cognitive functions (attention, working memory)
dyslexic people have different learning strategies to cope
App development
focused on mobile (Android)
testing: tried to put it in front of students as much as possible, ask questionnaires etc
difficulty: needs to be at the right level so that they’re neither bored nor frustrated
tasks:
attention/working memory: need to read instructions and remember how they relate to previous ones
spacial reasoning: map tiles
phonological recognition/analysis: see a word, hear different options, choose the right one
visual memory: have to click on the right things at the right time
visual recognition: recognizing “alien” writing symbols, some of which are similar to others
phonological memory: remember the content/order of sounds you heard
also includes “badges” for completing exercises, statistics view of progress, and “encyclopedia” with info about dyslexia (which also has voice recordings of all texts)
Does it work?
studying it is difficult: we need a lot of children diagnosed with dyslexia, and let them play the game for some time
children are not going to school regularly - problems with attendance
Language
We focused on Czech
Dyslexia is closely related to the language
aspects that dyslexic children struggle with are different from e.g. Czech to German
Interacting with insecure SSL pages (eg. self-signed) in an automated test written for Selenium is an important feature. Especially when tests are getting run against locally served test pages. Under those circumstances you might never get fully secured websites served to the browser instance under test. To still allow running your tests with a successful test result, Selenium can instruct the browser to ignore the validity check, which will simply browse to the specified site without bringing up the SSL error page.
Since the default driver for Firefox was switched in Selenium 3.0 to Marionette by default, this feature was broken for a while, unless you explicitly opted-out from using it. The reason is that Marionette, which is the automation driver for Mozilla’s Gecko engine, hasn’t implement it yet. But now with bug 1103196 fixed, the feature is available starting with the upcoming Firefox 52.0 release, which will soon be available as Beta build.
Given that a couple of people have problems to get it working correctly, I wrote a basic Selenium test for Firefox by using the Python’s unittest framework. I hope that it helps you to figure out the remaining issues. But please keep in mind that you need at least a Firefox 52.0 build.
Here the code:
import unittest

from selenium import webdriver
from selenium.webdriver.common.desired_capabilities import DesiredCapabilities

class InsecureSSLTestCase(unittest.TestCase):

def setUp(self):
self.test_url = 'https://self-signed.badssl.com/'

capabilities = DesiredCapabilities.FIREFOX.copy()
self.driver = webdriver.Firefox(capabilities=capabilities,
firefox_binary='/path/to/firefox/binary')
self.addCleanup(self.driver.quit)

def test_page(self):
self.driver.get(self.test_url)
self.assertEqual(self.driver.current_url, self.test_url)

if __name__ == '__main__':
unittest.main(verbosity=2)
By using DesiredCapabilities.FIREFOX the default capabilities for Firefox will be retrieved and used. Those will also include “marionette: True“, which is necessary to enable webdriver for Firefox in Selenium 3. If not present the old FirefoxDriver will be utilized.
To actually enable accepting insecure SSL pages, the capabilities have to be updated with “acceptInsecureCerts: True“, and then passed into the Firefox’s Webdriver constructor.
That’s all. So enjoy!
Update: The capability for acceptInsecureCerts is set automatically when DesiredCapabilities.FIREFOX is used.
I wrote earlier about my initial experience with triaging frequent intermittent test failures. I was happy to find that most of the most-frequent test failures were under active investigation, but that also meant that finding important bugs in need of triage was a frustrating and time consuming process.
Thankfully, :ekyle provided me with a script to identify “neglected oranges”: Frequent intermittent test failure bugs with no recent comments. The neglected oranges script provides search results not unlike the default search on Orange Factor, but filters out bugs with recent comments from non-robots. It also shows the bug age and how long it has been since the last comment:
This has provided a treasure trove of bugs for triage.
So, now that I can find bugs for frequent intermittent failures that don’t have anyone actively working on them, can I instigate action? Does this type of triage lead to bug resolution and a reduction in Orange Factor (average number of failures per push)? Here’s one way of looking at it: If I look at the bugs I’ve recently triaged and look at the time those bugs were open before I commented on them, I find that, on average, those bugs were open for 65 days before my triage comment. Typically I tried to find someone familiar with the bug and pointed out that it was a frequently failing test; sometimes I offered some insight, or suggested some action (“this is a timeout in a long-running test; if it cannot be optimized or split up, requestLongerTimeout() should avoid the timeout”). On average, those bugs were resolved within 3 days of my triage comment. Wow!
I offer this evidence that triage of neglected oranges makes a difference, but also caution not to expect that much of a difference over time: I’ve chosen bugs that were open for months and with continued triage, we may quickly eliminate these long-neglected bugs (let’s hope!). I’ve also likely chosen “easy” bugs – bugs with an obvious, or at least apparent, resolution. There will also be intractable bugs, surely, and bugs without any apparent owner, or where interested parties cannot agree on a solution.
It is similarly difficult to draw conclusions from Orange Factor failure rates, but let’s look at those anyway, roughly for the time period I have been triaging:
That’s encouraging, isn’t it? I don’t know how much of that improvement was instigated by my triage comments, but I like to think I have contributed to the improvement, and that this type of action can continue to drive down failure rates. I’ll keep spending at least a few hours each week on neglected oranges, and see how that goes for the next couple of months. Can we bring Orange Factor under 10? Under 5?
Many of our frequent intermittent test failures are timeouts. There are a lot of ways that a test – or a test job – can time out. Some popular bug titles demonstrate the range of failure messages:
This test exceeded the timeout threshold. It should be rewritten or split up. If that’s not possible, use requestLongerTimeout(N), but only as a last resort.
Test timed out.
TEST-UNEXPECTED-TIMEOUT
TimeoutException: Timed out after … seconds
application ran for longer than allowed maximum time
application timed out after … seconds with no output
Task timeout after 3600 seconds. Force killing container.
We have tried re-wording some of these messages with the aim of clarifying the cause of the timeout and possible remedies, but I still see lots of confusion in bugs. In some cases, I think a complete explanation is much more involved than we can hope to express in an error message. I think we should write up a wiki page or MDN article with detailed explanations of messages like this, and point to that page from error messages in the test log.
One of the first things I do when I see a test failure due to timeout is look for a successful run of the same test on the same platform, and then compare the timing between the success and failure cases. If a test takes 4 seconds to run in the success case but times out after 45 seconds, perhaps there is an intermittent hang; but if the test takes 40 seconds to run successfully and intermittently times out after 45 seconds, it’s probably just a long running test with normal variation in run time.
This suggests some nice-to-have tools:
push a new test to try, get a report of how long your test runs on each platform, perhaps with a warning if run-time approaches known time-outs, or perhaps some arbitrary threshold;
same for longest duration without output (avoid “no output timeout”);
use custom code or a special test harness mode to identify existing long-running tests, for proactive follow-up to prevent timeouts in the future.
Recently, I have been trying to spend a little time each day looking over the most frequent intermittent test failures in search of neglected bugs. I use Orange Factor to identify the most frequent failures, then scan the associated bugs in bugzilla to see if there is someone actively working on the bug.
I have had some encouraging successes. For example, in bug 1307388, I found a frequent intermittent with no one assigned and no sign of activity. The test had started failing recently – a few days earlier – with no sign of failures before that. A quick check of the mercurial logs showed that the test had been modified the day that it started failing, and a needinfo of the patch author led to immediate action.
In bug 1244707, the bug had been triaged several months ago and assigned to backlog, but the failure frequency had since increased dramatically. Pinging someone familiar with the test quickly led to discussion and resolution.
My experience in each of these cases was really rewarding: It took me just a few minutes to review the bug and bring it to the attention of someone who was interested and understood the failure.
Finding neglected bugs is more onerous. Orange Factor can be used to identify frequent test failures; the default view on https://brasstacks.mozilla.com/orangefactor/ provides a list, ordered by frequency, but most of those are not neglected — some one is already working on them and they just need time to investigate and land a fix. I think the sheriffs do a good job of finding owners for frequent intermittents, so it seems like 90% of the top intermittents have owners, and they are usually actively working on resolving those issues. I don’t think there’s any way to see that activity on Orange Factor:
So I end up opening lots of bugs each day before I find one that “needs help”. Broadly speaking, I’m looking for a search for bugs matching something like:
OrangeFactor does a good job of identifying the frequent failures, but I don’t think it has any data on bug activity…and this notion of bug activity is hazy anyway. Ping me if you have a better intermittent orange triage procedure, or thoughts on how to do this more efficiently.
** Update – I’ve been getting lots of ideas from folks on irc for better triaging:
ryanvm
look to aurora/beta for bugs that have been around for longer
would be nice if a dashboard would show trends for a bug (now happening more frequently, etc) – like socorro
bugzilla data fed to presto, so marrying it to treeherder with redash may be possible (mdoglio may know more)
wlach
might be able to use redash for change detection/trends once treeherder’s db is hooked up to it
ekyle
there’s an OrangeFactorv2 planned
the bugzilla es cluster has all bug data in easy to query format
Our automated tests seem to fail a lot. Instead of a sea of green, a typical good push often looks more like:
I’ve been thinking about ways that we can improve on that: Ways that we can reduce those pesky intermittent oranges.
Here’s one idea: Be more aggressive about disabling (skipping) tests that fail intermittently.
For today anyway, let’s put aside those tests that fail infrequently. If a test fails only rarely, there’s less to be gained by skipping it. It may also be harder to reproduce such failures, and harder to fix them and get them running again.
Instead, let’s concentrate (for now) on frequent, persistent test failures. There are lots of them:
Notice that the most frequent intermittent failure for this one-week period is bug 1157948, which failed 721 times (well, it was reported/starred 721 times — it probably failed more than that!). Guess what happened the week before that? Yeah, another 700 or so oranges. And the week before that and … This is definitely a persistent, frequent intermittent failure.
I am actually intimately familiar with bug 1157948. I’ve worked hard to resolve it, and lots of other people have too, and I’m hopeful that a fix is landing for it right now. Still, it took over 3 months to fix this. What did we gain by running the affected tests for those 3 months? Was it worth the 10000+ failures that sheriffs and developers saw, read, diagnosed, and starred?
Bug 1157948 affected all taskcluster-initiated Android tests, so skipping the affected tests would have meant losing a lot of coverage. But it is not difficult to find other bugs with over 100 failures per week that affect just one test (like bug 1305601, just to point out an example). It would be easy to disable (skip-if annotate) this test while we work on it, and wouldn’t that be better? It won’t be fixed overnight, but it will continue to fail overnight — and there’s a cost to that.
There’s a trade-off here for sure. A skipped test means less coverage. If another change causes a spontaneous fix to this test, we won’t notice the change if it is skipped. And we won’t notice a change in the frequency of failures. How important are these considerations, and are they important enough that we can live with seeing, reporting, and tracking all these test failures?
I’m not yet sure about the particulars of when and how to skip intermittent failures, but it feels like we would profit by being more aggressive about skipping troublesome tests, particularly those that fail frequently and persistently.
Recent outstanding improvements in APK size, memory use, and startup time, all due to :esawin’s efforts in bug 1291424.
APK Size
You can see the size of every build on treeherder using Perfherder.
Here’s how the APK size changed over the quarter, for mozilla-central Android 4.0 API15+ opt builds:
As seen in the past, the APK size seems to gradually increase over time. But this quarter there is a pleasant surprise, with a recent very large improvement. That is :esawin’s change from bug 1291424. Nice!
Again, there is a tremendous improvement with bug 1291424. Thankyou :esawin!
Autophone-Talos
This section tracks Perfherder graphs for mozilla-central builds of Firefox for Android, for Talos tests run on Autophone, on android-6-0-armv8-api15. The test names shown are those used on treeherder. See https://wiki.mozilla.org/Buildbot/Talos for background on Talos.
tsvgx
An svg-only number that measures SVG rendering performance. About half of the tests are animations or iterations of rendering. This ASAP test (tsvgx) iterates in unlimited frame-rate mode thus reflecting the maximum rendering throughput of each test. The reported value is the page load time, or, for animations/iterations – overall duration the sequence/animation took to complete. Lower values are better.
tp4m
Generic page load test. Lower values are better.
No significant improvements or regressions noted for tsvgx or tp4m.
Autophone
Throbber Start / Throbber Stop
Browser startup performance is measured on real phones (a variety of popular devices).
Here’s a quick summary for the local blank page test on various devices:
Again, there is an excellent performance improvement with bug 1291424. Yahoo!
See bug 953342 to track autophone throbber regressions (none this quarter).
Welcome back to my post series on the Marionette project! In Act I, we looked into Marionette’s automation framework for Gecko, the engine behind the Firefox browser. Here in Act II, we’ll take a look at a complementary side of the Marionette project: the testing framework that helps us run tests using our Marionette-animated browser, aka the Marionette test harness. If – like me at the start of my Outreachy internship – you’re clueless about test harnesses, or the Marionette harness in particular, and want to fix that, you’re in the right place!
Marionette refers to a suite of tools for automated testing of Mozilla browsers.
In that post, we saw how the Marionette automation framework lets us control the Gecko browser engine (our “puppet”), thanks to a server component built into Gecko (the puppet’s “strings”) and a client component (a “handle” for the puppeteer) that gives us a simple Python API to talk to the server and thus control the browser. But why do we need to automate the browser in the first place? What good does it do us?
Well, one thing it’s great for is testing. Indulge me in a brief return to my puppet metaphor from last time, won’t you? If the automation side of Marionette gives us strings and a handle that turn the browser into our puppet, the testing side of Marionette gives that puppet a reason for being, by letting it perform: it sets up a stage for the puppet to dance on, tell it to carry out a given performance, write a review of that performance, and tear down the stage again.
OK, OK, metaphor-indulgence over; let’s get real.
Wait, why do we need automated browser testing again?
As Firefox1 contributors, we don’t want to have to manually open up Firefox, click around, and check that everything works every time we change a line of code. We’re developers, we’re lazy!
But we can’t not do it, because then we might not realize that we’ve broken the entire internet (or, you know, introduced a bug that makes Firefox crash, which is just as bad).
So instead of testing manually, we do the same thing we always do: make the computer do it for us!
The type of program that can magically do this stuff for us is called a test harness. And there’s even a special version specific to testing Gecko-based browsers, called – can you guess? – the Marionette test harness, also known as the Marionette test runner.
So, what exactly is this magical “test harness” thing? And what do we need to know about the Marionette-specific one?
What’s a test harness?
First of all, let’s not get hung up on the name “test harness” – the names people use to refer to these things can be a bit ambiguous and confusing, as we saw with other parts of the Marionette suite in Act I. So let’s set aside the name of the thing for now, and focus on what the thing does.
Assuming we have a framework like the Marionette client/server that lets us automatically control the browser, the other thing we need for automatically testing the browser is something that lets us:
Properly set up & launch the browser, and any other related components we might need
Define tests we want to perform and their expected results
Discover tests defined in a file or directory
Run those tests, using the automation framework to do the stuff we want to do in the browser
Keep track of what we actually saw, and how it compares to what we expected to see
Report the results in human- and/or machine-readable logs
Clean up all of that stuff we set up in the beginning
Take out the browser-specific parts, and you’ve got the basic outline of what a test harness for any kind of software should do.
Ever write tests using Python’s unittest, JavaScript’s mocha, Java’s JUnit, or a similar tool? If you’re like me, you might have been perfectly happy writing unit tests with one of these, thinking not:
Yeah, I know unittest! It’s a test harness.
but rather:
Yeah, I know unittest! It’s, you know, a, like, thing for writing tests that lets you make assertions and write setup/teardown methods and stuff and, like, print out stuff about the test results, or whatever.
Turns out, they’re the same thing; one is just shorter (and less, like, full of “like”s, and stuff).
So that’s the general idea of a test harness. But we’re not concerned with just any test harness; we want to know more about the Marionette test harness.
What’s special about the Marionette test harness?
Um, like, duh, it’s made for tests using Marionette!
What I mean is that unlike an all-purpose test harness, the Marionette harness already knows that you’re a Mozillian specifically interested in is running Gecko-based browser tests using Marionette. So instead of making you write code in for setup/teardown/logging/etc. that talks to Marionette and uses other features of the Mozilla ecosystem, it does that legwork for you.
You still have control, though; it makes it easy for you to make decisions about certain Mozilla-/Gecko-specific properties that could affect your tests, like:
Need to use a specific Firefox binary? Or a particular Firefox instance running on a device somewhere?
Got a special profile or set of preferences you want the browser to run with?
Need to run an individual test module? A directory full of tests? Tests listed in a manifest file?
Want the tests run multiple times? Or in chunks?
How and where should the results be logged?
Care to drop into a debugger if something goes wrong?
But how does it do all this? What does it look like on the inside? Let’s dive into the code to find out.
How does the Marionette harness work?
Inside Marionette, in the file harness/marionette/runtests.py, we find the MarionetteHarness class. MarionetteHarness itself is quite simple: it takes in a set of arguments that specify the desired preferences with respect to the type of decisions we just mentioned, uses an argument parser to parse and process those arguments, and then passes them along to a test runner, which runs the tests accordingly.
So actually, it’s the “test runner” that does the brunt of the work of a test harness here. Perhaps for that reason, the names “Marionette Test Harness” and “Marionette Test Runner” sometimes seem to be used interchangeably, which I for one found quite confusing at first.
Anyway, the test runner that MarionetteHarness makes use of is the MarionetteTestRunner class defined in runtests.py, but that’s really just a little wrapper around BaseMarionetteTestRunner from harness/marionette/runner/base.py, which is where the magic happens – and also where I’ve spent most of my time for my Outreachyinternship, but more on that later. For now let’s check out the runner!
How does Marionette’s test runner work?
The beating heart of the Marionette test runner is the method run_tests. By combining some methods that take care of general test-harness functionality and some methods that let us set up and keep tabs on a Marionette client-server session, run_tests gives us the Marionette-centric test harness we never knew we always wanted. Thanks, run_tests!
To get an idea of how the test runner works, let’s take a walk through the run_tests method and see what it does.2
First of all, it simply initializes some things, e.g. timers and counters for passed/failed tests. So far, so boring.
Next, we get to the part that puts the “Marionette” in “Marionette test runner”. The run_tests method starts up Marionette, by creating a Marionette object – passing in the appropriate arguments based on the runner’s settings – which gives us the client-server session we need to automate the browser in the tests we’re about to run (we know how that all works from Act I).
Adding the tests we want to the runner’s to-run list (self.tests) is the next step. This means finding the appropriate tests from test modules, a directory containing test modules, or a manifest file listing tests and the conditions under which they should be run.
Given those tests, after gathering and logging some info about the settings we’re using, we’re ready to run! (Perhaps multiple times, if repeated runs were requested.)
To actually run the tests, the runner calls run_test_sets, which runs the tests we added earlier, possibly dividing them into several sets (or chunks) that will be run separately (thus enabling parallelization). This in turn calls run_test_set, which basically just calls run_test, which is the final turtle.3
Glancing at run_test, we can see how the Marionette harness is based on Python’s unittest, which is why the tests we run with this harness basically look like unittest tests (we’ll say a bit more about that below). Using unittest to discover our test cases in the modules we provided, run_testruns each test using a MarionetteTextTestRunner and gets back a MarionetteTestResult. These are basically Marionette-specific versions of classes from moztest, which helps us store the test results in a format that’s compatible with other Mozilla automation tools, like Treeherder. Once we’ve got the test result, run_test simply adds it to the runner’s tally of test successes/failures.
So, that’s how run_tests (and its helper functions) execute the tests. Once all the tests have been run, our main run_tests method basically just logs some info about how things went, and which tests passed. After that, the runner cleans up by shutting down Marionette and the browser, even if something went wrong during the running or logging, or if the user interrupted the tests.
So there we have it: our very own Marionette-centric test-runner! It runs our tests with Marionette and Firefox set up however we want, and also gives us control over more general things like logging and test chunking. In the next section, we’ll take a look at how we can interact with and customize the runner, and tell it how we want our tests run.
What do the tests look like?
As for the tests themselves, since the Marionette harness is an extension of Python’s unittest, tests are mostly written as a custom flavor of unittest test cases. Tests extend MarionetteTestCase, which is an extension of unittest.TestCase. So if you need to write a new test using Marionette, it’s as simple as writing a new test module named test_super_awesome_things.py which extends that class with whatever test_* methods you want – just like with vanilla unittest.
Once we’ve got our super awesome new test, we can run it (with whatever super awesome settings we want) using the harness’s command-line interface. Let’s take a look at how that interface works.
What is the interface to the harness like?
Let’s peek at the constructor method for the BaseMarionetteTestRunner class:
Our first thought might be, “Wow, that’s a lot of arguments”. Indeed! This is how the runner knows how you want the tests to be run. For example, binary is the path to the specific Firefox application binary you want to use, and e10s conveys whether or not you want to run Firefox with multiple processes.
Where do all these arguments come from? They’re passed to the runner by MarionetteHarness, which gets them from the argument parser we mentioned earlier, MarionetteArguments.
Analogous to MarionetteTestRunner/BaseMarionetteTestRunner, MarionetteArgument is just a small wrapper around BaseMarionetteArguments from runner/base.py, which in turn is just an extension of Python’s argparse.ArgumentParser. BaseMarionetteArguments defines which arguments can be passed in to the harness’s command-line interface to configure its settings. It also verifies that whatever arguments the user passed in make sense and don’t contract each other.
To actually use the harness, we can simply call the runtests.py script with: python runtests.py [whole bunch of awesome arguments]. Alternatively, we can use the Mach commandmarionette-test (which just calls runtests.py), as described here.
To see all of the available command-line options (there are a lot!), you can run python runtests.py --help or ./mach marionette-test --help, which just spits out the arguments and their descriptions as defined in BaseMarionetteArguments.
So, with the simple command mach marionette-test [super fancy arguments] test_super_fancy_things.py, you can get the harness to run your Marionette tests with whatever fancy options you desire to fit your specific fancy scenario.
But what if you’re extra fancy, and have testing needs that exceed the limits of what’s possible with the (copious) command-line options you can pass to the Marionette runner? Worry not! You can customize the runner even further by extending the base classes and making your own super-fancy harness. In the next section, we’ll see how and why you might do that.
How is the Marionette test harness used at Mozilla?
Other than enabling people to write and run their own tests using the Marionette client, what is the Marionette harness for? How does Mozilla use it internally?
Well, first and foremost, the harness is used to run the Marionette Python unit tests we described earlier, which check that Marionette is functioning as expected (e.g. if Marionette tells the browser to check that box, then by golly that box better get checked!). Those are the tests that will get run if you just run mach marionette-test without specifying any test(s) in particular.
But that’s not all! I mentioned above that there might be special cases where the runner’s functionality needs to be extended, and indeed Mozilla has already encountered this scenario a couple of times.
One example is the Firefox UI tests, and in particular the UI update tests. These test the functionality of e.g. clicking the “Update Firefox” button in the UI, which means they need to do things like compare the old version of the application to the updated one to make sure that the update worked. Since this involves binary-managing superpowers that the base Marionette harness doesn’t have, the UI tests have their own runner, FirefoxUITestRunner, which extends BaseMarionetteTestRunner with those superpowers.
Another test suite that makes use of a superpowered harness is the External Media Tests, which tests video playback in Firefox and need some extra resources – namely a list of video URLs to make available to the tests. Since there’s no easy way to make such resources available to tests using the base Marionette harness, the external media tests have their own test harness which uses the custom MediaTestRunner and MediaTestArguments (extensions of BaseMarionetteTestRunner and BaseMarionetteArguments, respectively), to allow the user to e.g. specify the video resources to use via the command line.
So the Marionette harness is used in at least three test suites at Mozilla, and more surely can and will be added as the need arises! Since the harness is designed with automation in mind, suites like marionette-test and the Firefox UI tests can be (and are!) run automatically to make sure that developers aren’t breaking Firefox or Marionette as they make changes to the Mozilla codebase. This all makes the Marionette harness a rather indispensable development tool.
Which brings us to a final thought…
How do we know that the harness itself is running tests properly?
The Marionette harness, like any test harness, is just another piece of software. It was written by humans, which means that bugs and breakage are always a possibility. Since breakage or bugs in the test harness could prevent us from running tests properly, and we need those tests to work on Firefox and other Mozilla tools, we need to make sure that they get caught!
Do you see where I’m going with this? We need to… wait for it…
Test the thing that runs the tests
Yup, that’s right: Meta-testing. Test-ception. Tests all the way down.
And that’s what I’ve been doing this summer for my Outreachy project: working on the tests for the Marionette test harness, otherwise known as the Marionette harness (unit) tests. I wrote a bit about what I’ve been up to in my previous post, but in my next and final Outreachy post, I’ll explain in more detail what the harness tests do, how we run them in automation, and what improvements I’ve made to them during my time as a Mozilla contributor.
3 If you think distinguishing run_tests, run_test_sets, run_test_set, and run_test is confusing, I wholeheartedly agree with you! But best get used to it; working on the Marionette test harness involves developing an eagle-eye for plurals in method names (we’ve also got _add_tests and add_test). ↩
It feels like yesterday that I started my Outreachy internship, but it was actually over 2 months ago! For the last couple of weeks I’ve been on Outreachy hiatus because of EuroPython, moving from Saarbrücken to Berlin, and my mentor being on vacation. Now I’m back, with 6 weeks left in my internship! So it seems like a good moment to check in and reflect on how things have been going so far, and what’s in store for the rest of my time as an Outreachyee.
What have I been up to?
Learning how to do the work
In the rather involved application process for Outreachy, I already had to spend quite a bit of time figuring out the process for making even the tiniest contribution to the Mozilla codebase. But obviously one can’t learn everything there is to know about a project within a couple of weeks, so a good chunk of my Outreachy time so far was spent on getting better acquainted with:
The tools
I’ve already written about my learning experiences with Mercurial, but there were a lot of other components of the Mozilla development process that I had to learn about (and am still learning about), such as Bugzilla, MozReview, Treeherder, Try, Mach…
Then, since the project I’m working focuses on testing, I had to grok things like Pytest and Mock. Since most everything I’m doing is in Python, I’ve also been picking up useful Python tidbits here and there.
The project
My internship project, “Test-driven refactoring of Marionette’s Python test runner”, relates to a component of the Marionette project, which encompasses a lot of moving parts. Even figuring out what Marionette is, what components it comprises, how these interrelate, and which of them I need to know about, was a non-trivial task. That’s why I’m writing a couple of posts about the project itself - one down, one to go - to crystallize what I’ve learned and hopefully make it a little easier for other people to get through the what-even-is-it steps that I’ve been going through. This post is a sort of “intermission”, so stay tuned for my upcoming post on the Marionette test runner and harness!
Doing the work
Of course, there’s a reason I’ve been trying to wrap my head around all the stuff I just mentioned: so that I can actually do this project! So what is the actual work I’ve been doing, i.e. my overall contribution to Mozilla as an Outreachy intern?
The “thing” is the Marionette test runner, a tool written in Python that allows us to run tests that make use of Marionette to automate the browser. It’s responsible for things like discovering which tests we need to run, setting up all the necessary prerequisites, running the tests one by one, and logging all of the results.
Since the test runner is essentially a program like any other, it can be broken just like any other! And since it’s used in automation to run the tests that let Firefox developers know if some new change they’ve introduced breaks something, if the test runner itself breaks, that could cause a lot of problems. So what do we do? We test it!
That’s where I come in. My mentor, Maja, had started writing some unit tests for the test runner before the internship began. My job is basically to add more tests. This involves:
Reading the code to identify things that could break and cause problems, and thus should be tested
Refactoring the code to make it easier to test, more readable, easier to extend/change, or otherwise better
Aside from the testing side of things, another aspect of the project (which I particularly enjoy) involves improving how the runner relates to the rest of the world. For example, improving the command line interface to the runner, or making sure the unit tests for the runner are producing logs that play nicely with the rest of the Mozilla ecosystem.
Writing stuff down
As you can see, I’ve also been spending a fair bit of time writing blog posts about what I’ve been learning and encountering over the course of my internship. Hopefully these have been or will be useful to others who might also be wrapping their heads around these things for the first time. But regardless, writing them has certainly been useful for me!
What’s been fun?
Learning all the things
While working with a new system or technology can often be frustrating, especially when you’re used to something similar-but-not-quite-the-same (ahem, git and hg), I’ve found that the frustration does subside (or at least lessen) eventually, and in its place you find not only the newfound ease of working with the new thing, but also the gratification that comes with the realization: “Hey! I learned the thing!” This makes the overall experience of grappling with the learning curve fun, in my experience.
Working remotely
This internship has been my first experience with a lifestyle that always attracted me: working remotely. I love the freedom of being able to work from home if I have things to take care of around the house, or at a cafe if I just really need to sip on a Chocolate Chai Soy Latte right now, or from the public library if I want some peace & quiet. I also loved being able to escape Germany for 2 weeks to visit my boyfriend’s family in Italy, or to work a day out of the Berlin office if I’m there for a long weekend looking at apartments. Now that I’ve moved to Berlin, I love the option of working out of the office here if I want to, or working from home or a cafe if I have things I need to take care of on the other side of the city. And because the team I’m working on is also completely distributed, there’s a great infrastructure already in place (IRC, video conferences, collaborative documents) to enable us to work in completely different countries/time zones and still feel connected.
Helping others get started contributing!
A couple of weeks ago I got to mentor my first bug on Bugzilla, and help someone else get started contributing to the thing that I had gotten started contributing to a few months ago for my Outreachy internship. Although it was a pretty simple & trivial thing, it felt great to help someone else get involved, and to realize I knew the answers to a couple of their questions, meaning that I’m actually already involved! That’s the kind of thing that really makes me want to continue working with FOSS projects after my internship ends, and makes me so appreciative of initiatives like Outreachy that help bring newcomers like me into this community.
What’s been hard?
Impostor Syndrome
The flip side of the learning-stuff fun is that, especially at the beginning, ye olde Impostor Syndrome gets to run amok. When I started my internship, I had the feeling that I had Absolutely No Idea what I was doing – over the past couple of months it has gotten gradually better, but I still have the feeling that I have a Shaky and Vague Idea of what I’m doing. From my communications with other current/former Outreachy interns, this seems to be par for the course, and I suppose it’s par for the course for anyone joining a new project or team for the first time. But even if it’s normal, it’s still there, and it’s still hard.
Working remotely
As I mentioned, overall I’ve been really enjoying the remote-work lifestyle, but it does have its drawbacks. When working from home, I find it incredibly difficult to separate my working time from my not-working time, which is most often manifested in my complete inability to stop working at the end of the day. Because I don’t have to physically walk away from my computer, at the end of the day I think “Oh, I’ll just do that one last thing,” and the next thing I know the Last Thing has led to 10 other Last Things and now it’s 11:00pm and I’ve been working for 13 hours straight. Not healthy, not fun. Also, while the flexibility and freedom of not having a fixed place of work is great, moving around (e.g. from Germany to Italy to other side of Germany) can also be chaotic and stressful, and can make working (productively) more difficult – especially if you’re not sure where your next internet is going to come from. So the remote work thing is really a double-edged sword, and doing in a way that preserves both flexibility and stability is clearly a balancing act that takes some practice. I’m working on it.
Measuring productivity
Speaking of working productively, how do you know when you’re doing it? Is spending a whole day reading about mock objects, or writing a blog post, or banging your head against a build failure, or [insert activity that is not writing 1000 lines of code] productive? The nature of the Outreachy system is that every project is different, and the target outcomes (or lack thereof) are determined by the project mentor, and whether or not your work is satisfactory is entirely a matter of their judgment. Luckily, my mentor is extremely fair, open, clear, and realistic about her goals for the project. She’s also been very reassuring when I’ve expressed uncertainty about productivity, and forthcoming about her satisfaction with my progress. But I feel like this is just my good luck having a mentor who a) is awesome and b) was an Outreachy intern herself once, and can thus empathize. I do wonder how my experience would be different, especially from the standpoint of knowing whether I’m measuring up to expectations, if I were on a different project with a different mentor. Which brings me to…
What’s been helpful?
Having a fantastic mentor
As I’ve just said, I feel really lucky to be working with my mentor, Maja. She’s been an incredible support throughout the internship, and has just made it a great experience. I’m really thankful for her for being so detailed & thorough in her initial conception of the project and instructions to me, and for being so consistently responsive and helpful with any of my questions or concerns. I can’t imagine a better mentor.
Being part of a team
“It takes a village,” or whatever they say, and my village is the Automation crew (who hang out in #automation on IRC) within the slightly-larger village of the Engineering Productivity team (A-Team) (#ateam). Just like my mentor, the rest of the crew and the team have also been really friendly and helpful to me so far. If Maja’s not there, if I’m working on some adjacent component, or if I have some general question, they’ve been there for me. And while having a fantastic mentor is fantastic, having a fantastic mentor within a fantastic team is double-fantastic, because it helps with the hard things like learning new tools or working remotely (especially when your mentor is in a different time zone, but other team members are in yours). So I’m also really grateful to the whole team for taking me in and treating me as one of their own.
Attending the All Hands
Apparently, at some point in the last couple of years, someone at Mozilla decided to start including Outreachy interns in the semi-annual All Hands meetings. Whoever made that decision: please accept my heartfelt thanks. Being included in the London All Hands made a real difference - not only because I understood a lot about various components of the Mozilla infrastructure that had previously been confusing or unclear to me, but also because the chance to meet and socialize with team members and other Outreachy interns face-to-face was a huge help in dealing with e.g. Impostor Syndrome and the challenges of working on a distributed team. I’m so glad I was able to join that meeting, because it really helped me feel more bonded to both Mozilla as a whole and to my specific team/project, and I hope for the sake of both Mozilla and Outreachy that Outreachyees continue to be invited to such gatherings.
Intern solidarity
Early on in the internship, one of the other Mozilla Outreachy interns started a channel just for us on Mozilla’s IRC. Having a “safe space” to check in with the other interns, ask “dumb” questions, express insecurities/frustrations, and just generally support each other is immensely helpful. On top of that, several of us got to hang out in person at the London All Hands meeting, which was fantastic. Having contact with a group of other people going through more or less the same exciting/bewildering/overwelming/interesting experience you are is invaluable, especially if you suffer from Impostor Syndrome as so many of us do. So I’m so grateful to the other interns for their support and solidarity.
What’s up next?
In the remaining weeks of my internship, I’m going to be continuing the work I mentioned, but instead of from a library in a small German town or a random internet connection in a small Italian town, I’ll be working mainly out of the Berlin office, and hopefully getting to know more Mozillians here. I’ll also be participating in the TechSpeakers program, a training program from the Mozilla Reps to improve your public speaking skills so that you can go forth and spread the word about Mozilla’s awesome technologies. Finally, in the last week or two, I’ll be figuring out how to pass the baton, i.e. tie up loose ends, document what I’ve done and where I’m leaving off, and make it possible for someone else – whether existing team or community members, or perhaps the next intern – to continue making the Marionette test runner and its unit tests Super Awesome. And blogging all the while, of course. :) Looking forward to it!
This piece is about too few names for too many things, as well as a kind of origin story for a web standard. For the past year or so, I’ve been contributing to a Mozilla project broadly named Marionette — a set of tools for automating and testing Gecko-based browsers like Firefox. Marionette is part of a larger browser automation universe that I’ve managed to mostly ignore so far, but the time has finally come to make sense of it.
The main challenge for me has been nailing down imprecise terms that have changed over time. From my perspective, “Marionette” may refer to any combination of two to four things, and it’s related to equally vague names like “Selenium” and “WebDriver”… and then there are things like “FirefoxDriver” and “geckodriver”. Blargh. Untangling needed.
Aside: integrating a new team member (like, say, a volunteer contributor or an intern) is the best! They ask big questions and you get to teach them things, which leads to filling in your own knowledge. Everyone wins.
The W3C WebDriver Specification
Okay, so let’s work our way backwards, starting from the future. (“The future is now.”) We want to remotely control browsers so that we can do things like write automated tests for the content they run or tests for the browser UI itself. It sucks to have to write the same test in a different way for each browser or each platform, so let’s have a common interface for testing all browsers on all platforms. (Yay, open web standards!) To this end, a group of people from several organizations is working on the WebDriver Specification.
The main idea in this specification is the WebDriver Protocol, which provides a platform- and browser- agnostic way to send commands to the browser you want to control, commands like “open a new window” or “execute some JavaScript.” It’s a communication protocol1 where the payload is some JSON data that is sent over HTTP. For example, to tell the browser to navigate to a url, a client sends a POST request to the endpoint /session/{session id of the browser instance you're talking to}/url with body {"url": "http://example.com/"}.
The server side of the protocol, which might be implemented as a browser add-on or might be built into the browser itself, listens for commands and sends responses. The client side, such as a Python library for automating browsers, send commands and processes the responses.
This broad idea is already implemented and in use: an open source project for browser automation, Selenium WebDriver, became widely adopted and is now the basis for an open web standard. Awesome! (On the other hand, oh no! The overlapping names begin!)
Selenium WebDriver
Where does this WebDriver concept come from? You may have noticed that lots of web apps are tested across different browsers with Selenium — that’s precisely what it was built for back in 2004-20092. One of its components today is Selenium WebDriver.
(Confusingly3, the terms “Selenium Webdriver, “Webdriver”, “Selenium 2” and “Selenium” are often used interchangeably, as a consequence of the project’s history.)
Selenium WebDriver provides APIs so that you can write code in your favourite language to simulate user actions like this:
client.get("https://www.mozilla.org/")
link = client.find_element_by_id("participate")
link.click()
Underneath that API, commands are transmitted via JSON over HTTP, as described in the previous section. A fair name for the protocol currently implemented in Selenium is Selenium JSON Wire Protocol. We’ll come back to this distinction later.
As mentioned before, we need a server side that understands incoming commands and makes the browser do the right thing in response. The Selenium project provides this part too. For example, they wrote FirefoxDriver which is a Firefox add-on that takes care of interpreting WebDriver commands. There’s also InternetExplorerDriver, AndroidDriver and more. I imagine it takes a lot of effort to keep these browser-specific “drivers” up-to-date.
Then something cool happened
A while after Selenium 2 was released, browser vendors started implementing the Selenium JSON Wire Protocol themselves! Yay! This makes a lot of sense: they’re in the best position to maintain the server side and they can build the necessary behaviour directly into the browser.
Selenium Webdriver (a.k.a. Selenium 2, WebDriver) provides a common API, protocol and browser-specific “drivers” to enable browser automation. Browser vendors started implementing the Selenium JSON Wire Protocol themselves, thus gradually replacing some of Selenium’s browser-specific drivers. Since WebDriver is already being implemented by all major browser vendors to some degree, it’s being turned into a rigorous web standard, and some day all browsers will implement it in a perfectly compatible way and we’ll all live happily ever after.
Is the Selenium JSON Wire Protocol the same as the W3C WebDriver protocol? Technically, no. The W3C spec is describing the future of WebDriver5, but it’s based on what Selenium WebDriver and browser vendors are already doing. The goal of the spec is to coordinate the browser automation effort and make sure we’re all implementing the same interface; each command in the protocol should mean the same thing across all browsers.
A Fresh Look at the Marionette Family
Now that I understand the context, my view of Marionette’s components is much clearer.
Marionette Server together with geckodriver make up Mozilla’s implementation of the W3C WebDriver protocol.
Marionette Server is built directly into Firefox (into the Gecko rendering engine) and it speaks a slightly different protocol. To make Marionette truly WebDriver-compatible, we need to translate between Marionette’s custom protocol and the WebDriver protocol, which is exactly what geckodriver does. The Selenium client can talk to geckodriver, which in turn talks to Marionette Server.
As I mentioned earlier, the plan for Selenium 3 is to have geckodriver replace Selenium’s FirefoxDriver. This is an important change: since FirefoxDriver is a Firefox add-on, it has limitations and is going to stop working altogether with future releases.
Marionette Client is Mozilla’s official Python library for remote control of Gecko, but it’s not covered by the W3C WebDriver spec and it’s not compatible with WebDriver in general. Think of it as an alternative to Selenium’s Python client with Gecko-specific features. Selenium + geckodriver should eventually replace Marionette Client, including the Gecko-specific features.
The Marionette project also includes tools for integrating with Mozilla’s intricate test infrastructure: Marionette Test Runner, a.k.a. the Marionette test harness. This part of the project has nothing to do with WebDriver, really, except that it knows how to run tests that depend on Marionette Client. The runner collects the tests you ask for, takes care of starting a Marionette session with the right browser instance, runs the tests and reports the results.6
As you can see, “Marionette” may refer to many different things. I think this ambiguity will always make me a little nervous… Words are hard, especially as a loose collection of projects evolves and becomes unified. In a few years, the terms will firm up. For now, let’s be extra careful and specify which piece we’re talking about.
Acknowledgements
Thanks to David Burns for patiently answering my half-baked questions last week, and to James Graham and Andreas Tolfsen for providing detailed and delightful feedback on a draft of this article. Bonus high-five to Anjana Vakil for contributions to Marionette Test Runner this year and for inspiring me to write this post in the first place.
Terminology lesson: the WebDriver protocol is a wire protocol because it’s at the application level and requires several applications working together. ↩
I give a range of years because Selenium WebDriver is a merger of two projects that started at different times. ↩
Abbreviated Selenium history and roadmap: Selenium 1 used an old API and mechanism called SeleniumRC, Selenium 2 favours the WebDriver API and JSON Wire Protocol, Selenium 3 will officially designate SeleniumRC as deprecated (“LegRC”, harhar), and Selenium 4 will implement the authoritative W3C WebDriver spec. ↩
Many of my claims about Marionette are confirmed by this historical artifact from 2012, which I came across shortly before publishing this post. ↩
For example, until recently Selenium WebDriver only included commands that are common to all browsers, with no way to use features that are specific to one. In contrast, the W3C WebDriver spec allows the possibility of extension commands. Extension commands are being implemented in Selenium clients right now! The future is now! ↩
Fun fact: Marionette is not only used for “Marionette Tests” at Mozilla. The client/server are also used to instrument Firefox for other test automation like mochitests and Web Platform Tests. ↩
In this two-part series, I’d like to share a bit of what I’ve learned about the Marionette project, and how its various components help us test Firefox by allowing us to automatically control the browser from within. Today, in Act I, I’ll give an overview of how the Marionette server and client make the browser our puppet. Later on, in Act II, I’ll describe how the Marionette test harness and runner make automated testing a breeze, and let you in on the work I’m doing on the Marionette test runner for my internship.
And since we’re talking about puppets, you can bet there’s going to be a hell of a lot of Being John Malkovich references. Consider yourself warned!
How do you test a browser?
On the one hand, you probably want to make sure that the browser’s interface, or chrome, is working as expected; that users can, say, open and close tabs and windows, type into the search bar, change preferences and so on. But you probably also want to test how the browser displays the actual web pages, or content, that you’re trying to, well, browse; that users can do things like click on links, interact with forms, or play video clips from their favorite movies.
Because let's be honest, that's like 96% of the point of the internet right there, no?
These two parts, chrome and content, are the main things the browser has to get right. So how do you test them?
Well, you could launch the browser application, type “Being John Malkovich” into the search bar and hit enter, check that a page of search results appears, click on a YouTube link and check that it takes you to a new page and starts playing a video, type “I ❤️ Charlie Kaufman and Spike Jonze” into the comment box and press enter, check that it submits the text…
And when you’re done, you could write up a report about what you tested, what worked and what didn’t, and what philosophical discoveries about the nature of identity and autonomy you made along the way.
Am I the puppet? AM I? Being John Malkovich via COADA on Tumblr
Now, while this would be fun, if you have to do it a million times it would be less fun, and your boss might think that it is not fun at all that it takes you an entire developer-hour to test one simple interaction and report back.
Wouldn’t it be better if we could magically automate the whole thing? Maybe something like:
importmagical_automated_browserasclientclient.navigate("https://www.youtube.com")client.find_element(By.ID,"search-bar").send_keys("Being John Malkovich")client.find_element(By.ID,"search-button").click()# etc., etc.
SPOILER ALERT: We can, thanks to the Marionette project!
What is Marionette?
Marionette refers to a suite of tools for automated testing of Mozilla browsers. One important part of the project is an automation framework for Gecko, the engine that powers Firefox. The automation side of Marionette consists of the Marionette server and client, which work together to make the browser your puppet: they give you a nice, simple little wooden handle with which you can pull a bunch of strings, which are tied to the browser internals, to make the browser and the content it’s displaying do whatever you want. The client.do_stuff code above isn’t even an oversimplification; that’s exactly how easy it becomes to control the browser using Marionette’s client and server. Pretty great right?
But Marionette doesn’t stop there! In addition to the client & server giving you this easy-peasy apparatus for automatic control of the browser, another facet of the Marionette project - the test harness and runner - provides a full-on framework for automatically running and reporting tests that utilize the automation framework. This makes it easy to set up your puppet and the stage you want it to perform on, pull the strings to make the browser dance, check whether the choreography looked right, and log a review of the performance. I can see the headline now:
Screenwriter Charlie Kaufman enthralls again with a brooding script for automated browser testing
You: GROAN. That's a terrible joke. Me: Sorry, it won't be the last. Hang in there, reader.
Being John Malkovich via the dissected frog (adapted with GIFMaker.me)
As I see it, the overall aim of the Marionette project is to make automated browser testing easy. This breaks down into two main tasks: automation and testing. Here in Act I, we’ll investigate how the Marionette server and client let us automate the browser. In the next post, Act II, we’ll take a closer look at how the Marionette test harness and runner make use of that automation to test the browser.
How do Marionette’s server and client automate the browser?
A real marionette is composed of three parts:
a puppet
strings
a handle
This is a great analogy for Marionette’s approach to automating the browser (I guess that’s why they named it that).
The puppet we want to move is the Firefox browser, or to be precise, the Gecko browser engine underlying it. We want to make all of its parts – windows, tabs, pages, page elements, scripts, and so forth – dance about as we please.
The handle we use to control it is the Marionette client, a Python library that gives us an API for accessing and manipulating the browser’s components and mimicking user interactions.
The strings, which connect handle to puppet and thus make the whole contraption work, are the Marionette server. The server comprises a set of components built in to Gecko (the bottom ends of the strings), and listens for commands coming in from the client (the top ends of the strings).
Photo adapted from "Marionettes from Being John Malkovich" by Alex Headrick, via Flickr
The puppet: the Gecko browser engine
So far, I’ve been talking about “the browser” as the thing we want to automate, and the browser I have in mind is (desktop) Firefox, which Marionette indeed lets us automate. But in fact, Marionette’s even more powerful than that; we can also use it to automate other products, like Firefox for Android (codenamed “Fennec”, so cute!) or FirefoxOS/Boot to Gecko (B2G). That’s because the puppet Marionette lets us control is actually not the Firefox desktop browser itself, but rather the Gecko browser engine on top of which Firefox (like Fennec, and B2G) is built. All of the above, and any other Gecko-based products, can in principle be automated with Marionette.1, 2
So what exactly is this Gecko thing we’re playing with? Well, I’ve already revealed that it’s a browser engine - but if you’re like me at the beginning of this internship, you’re wondering what a “browser engine” even is/does. MDN explains:
Gecko’s function is to read web content, such as HTML, CSS, XUL, JavaScript, and render it on the user’s screen or print it. In XUL-based applications Gecko is used to render the application’s user interface as well.
In other words, a browser engine like Gecko takes all that ugly raw HTML/CSS/JS code and turns it into a pretty picture on your screen (or, you know, not so pretty - but a picture, nonetheless), which explains why browser engines are also called “layout engines” or “rendering engines”.
And see that bit about “XUL”? Well, XUL (XML User interface Language) is a markup language Mozilla came up with that lets you write application interfaces almost as if they were web pages. This lets Mozilla use Gecko not only to render the websites that Firefox lets you navigate to, but also to render the interface of Firefox itself: the search bar, tabs, forward and back buttons, etc. So it’s safe to say that Gecko is the heart of Firefox. And other applications, like the aforementioned Fennec and FirefoxOS, as well as the Thunderbird email client.
But wait a minute; why do we have to go all the way down to Gecko to control the browser? It’s pretty easy to write add-ons to control Firefox’s chrome or content, so why can’t we just do that? Well, first of all, security issues abound in add-on territory, which is why add-ons typically run with limited privileges and/or require approval; so an add-on-based automation system would likely give under- or over-powered control over the browser. But in fact, the real reason Marionette isn’t an add-on is more historical. As browser automation expert and Mozillian David Burns explained at SeleniumConf 2013, Marionette was originally developed to test FirefoxOS, which had the goal of using Gecko to run the entire operating system of a smartphone (hence FirefoxOS being codenamed Boot to Gecko). FirefoxOS didn’t allow add-ons, so the Marionette team had to get creative and build an automation solution right into Gecko itself. This gave them the opportunity to make Marionette an implementation of the WebDriver specification, a W3C standard for a browser automation interface. The decision to build Marionette as part of Gecko rather than an add-on thus had at least two advantages: Marionette had native access to Gecko and didn’t have to deal with add-on security issues,3 and by making Marionette WebDriver-compliant, Mozilla helped advanced the standardization of browser automation.
So that’s why it’s Gecko, not Firefox, that Marionette ties strings to. In the next section, we’ll see what those knots look like.
The strings: the Marionette server
As mentioned in the previous section, Marionette is built into Gecko itself. Specifically, the part of Marionette that’s built into Gecko, which gives us native access to the browser’s chrome and content, is called the Marionette server. The server acts as the strings of the contraption: the “top end” listens for commands from the handle (i.e. the Marionette client, which we’ll get to in the next section), and the “bottom end” actually manipulates the Gecko puppet as instructed by our commands.
The code that makes up these strings is written in JavaScript and lives within the Firefox codebase at mozilla-central/testing/marionette. Let’s take a little tour, shall we?
The strings are embedded into Gecko via a component called MarionetteComponent, which, when enabled,4 starts up a MarionetteServer, which is the object that most directly represents the strings themselves.
MarionetteComponent is defined in components/marionettecomponent.js (which, incidentally, includes the funniest line in the entire Marionette codebase), while
MarionetteServer is defined in the file server.js. As you can see in server.js, MarionetteServer is responsible for tying the whole contraption together: it sets up a socket on a given port where it can listen for commands, and uses the dispatcher defined in dispatcher.js to receive incoming commands and send data about command outcomes back to the client. Together, the server and dispatcher provide a point of connection to the “bottom end” of the strings: GeckoDriver, or the part of Marionette that actually talks to the browser’s chrome and content.
GeckoDriver, so named because it’s the part of the whole Marionette apparatus that can most accurately be said to be the part automatically driving Gecko, is defined in a file that is unsurprisingly named driver.js. The driver unites a bunch of other specialized modules which control various aspects of the automation, pulling them together and calling on them as needed according to the commands received by the server.
Some examples of the “specialized modules” I’m talking about are:
element.js, which maps out and gives us access to all the elements on the page
interaction.js and action.js, which help us mimic mouse, keyboard, and touchscreen interactions
evaluate.js, which lets us execute JavaScript code
With the help of such modules, the driver allows us to grab on to whatever part of the browser’s chrome or content interests us and interact with it as we see fit.
The Marionette server thus lets us communicate automatically with the browser, acting as the strings that get tugged on by the handle and in turn pull on the various limbs of our Gecko puppet. The final part of the puzzle, and subject of the next section, is the handle we can use to tell Marionette what it is we want to do.
The handle: the Marionette client
For us puppeteers, the most relevant part of the whole marionette apparatus is the one we actually have contact with: the handle. In Marionette, that handle is called the Marionette client. The client gives us a convenient API for communicating with Gecko via the Marionette server and driver described in the previous section.
Written in user-friendly Python,5 the client is defined in the confusingly-named client/marionette_driver directory inside of mozilla-central/testing/marionette. The client and its API are described quite clearly in the refreshingly excellent documentation, which includes a quick tutorial that walks you through the basic functionality.
To start pulling Marionette’s strings, all we need to do is instantiate a Marionette object (a client), tell it to open up a “session” with the server, i.e. a unique connection that allows messages to be sent back and forth between the two, and give it some commands to send to the server, which (as we saw above) executes them in Gecko. And of course, this assumes that the instance of Firefox (or our Gecko-based product of choice) has Marionette enabled,4 i.e. that there’s a Marionette server ready and waiting for our commands; if the server’s disabled, the strings we’re pulling won’t actually be connected to anything.
The commands we give can either make changes to the browser’s state (e.g. navigate to a new page, click on an element, resize the window, etc.), or return information about that state (e.g. get the URL of the current page, get the value of a property of a certain element, etc.). When giving commands, we have to be mindful of which context we’re in, i.e. whether we’re trying to do something with the browser’s chrome or its content. Some commands are specific to one context or the other (e.g. navigating to a given URL is a content operation), while others work in both contexts (e.g. clicking on an element can pertain to either of the two). Luckily, the client API gives us an easy one-liner to switch from one context to another.
Let’s take a look at a little example (see the docs for more):
# Import browser automation magic
frommarionetteimportMarionettefrommarionette_driver.byimportBy# Instantiate the Marionette (client) class
client=Marionette(host='localhost',port=2828)# Start a session to talk to the server
# (otherwise, nothing will work because the strings aren't connected)
client.start_session()# Give a command and check that it worked
client.navigate("https://www.mozilla.org")assert"building a better Internet"inclient.title# Switch to the chrome context for a minute (content is default)
withclient.using_context(client.CONTEXT_CHROME):urlbar=client.find_element(By.ID,"urlbar")urlbar.send_keys("about:robots")# try this one out yourself!
# Close the window, which ends the session
client.close()
It’s as simple as that! We’ve got an easy-to-use, high-level API that gives us full control over the browser, in terms of both chrome and content. Given this simple handle provided by the client, we don’t really need to worry about the mechanics of the server strings or the Gecko puppet itself; instead, we can concern ourselves with the dance steps we want the browser to perform.
Arabesque? Pirouette? Pas de bourrée? You name it! Being John Malkovich via ScreenplayHowTo
The browser is our plaything! Now what?
So now we’ve seen how the Marionette client and server give us the apparatus to control the browser like a puppet. The client gives us a simple handle we can manipulate, the server ties strings to that handle that transmit our wishes directly to the Gecko browser engine, which dances about as we please.
But what about checking that it’s got the choreography right? Well, as mentioned above, the client API not only lets us make changes to the browser’s chrome and content, but also gives us information about their current state. And since it’s just regular old Python code, we can use simple assert statements to perform quick checks, as in the example in the last section. But if we want to test the browser and user interactions with it more thoroughly, we could probably use a more developed and full-featured testing framework.
ANOTHER SPOILER ALERT (well OK I actually already spoiled this one): the Marionette project gives us a tool for that too!
In Act II of this article, we’ll explore the Marionette test harness and runner, which wrap the server-client automation apparatus described here in Act I in a testing framework that makes it easy to set the stage, perform a dance, and write a review of the performance. See you back here after the intermission!
Sources
The brains of Mozillians David Burns, Maja Frydrychowicz, Henrik Skupin, and Andreas Tolfsen. Many thanks to them for their feedback on this article.
1 Emphasis on the “in principle” part, because getting Marionette to play nicely with all of these products may not be trivial. For example, my internship mentor Maja has been hard at work recently on the Marionette runner and client to make them Fennec-friendly. ↩
2 If you’re interested in automating a browser that doesn’t run on Gecko, don’t fret! Marionette is Gecko-specific, but it’s an implementation of the engine-agnostic WebDriver standard, a W3C specification for a browser automation protocol. Given a WebDriver implementation for the engine in question, any browser can in principle be automated in the same way that Marionette automates Gecko browsers. ↩
3 In fact, Marionette’s built-in design makes it able to circumvent the add-on signing requirement mentioned earlier; this would be dangerous if exposed to end users (see 4), but comes in handy when Mozilla developers need to inject unsigned add-ons into development versions of Gecko browsers in automation. ↩
4 At this point (or some much-earlier point) you might be wondering:
Wait a minute - if the Marionette server is built into Gecko itself, and gives us full automatic control of the browser, isn’t that a security risk?
5 Prefer to talk to the Marionette server from another language? No problem! All you need to do is implement a client in your language of choice, which is pretty simple since the WebDriver specification that Marionette implements uses bog-standard JSON over HTTP for client-server communications. If you want to use JavaScript, your job is even easier: you can take advantage of a JS Marionette client developed for the B2G project. ↩
You can see the size of every build on treeherder using Perfherder.
Here’s how the APK size changed over the quarter, for mozilla-central Android 4.0 API15+ opt builds:
APK size generally grew, generally in small increments. Our APK is about 1.3 MB larger today than it was 3 months ago. The largest increase, of about 400 KB around May 4, was caused by and discussed in bug 1260208. The largest decrease, of about 200 KB around April 25, was caused by bug 1266102.
For the same period, libxul.so also generally grew gradually:
These memory measurements are fairly steady over the quarter, with a gradual increase over time.
Autophone-Talos
This section tracks Perfherder graphs for mozilla-central builds of Firefox for Android, for Talos tests run on Autophone, on android-6-0-armv8-api15. The test names shown are those used on treeherder. See https://wiki.mozilla.org/Buildbot/Talos for background on Talos.
tsvgx
An svg-only number that measures SVG rendering performance. About half of the tests are animations or iterations of rendering. This ASAP test (tsvgx) iterates in unlimited frame-rate mode thus reflecting the maximum rendering throughput of each test. The reported value is the page load time, or, for animations/iterations – overall duration the sequence/animation took to complete. Lower values are better.
tp4m
Generic page load test. Lower values are better.
No significant improvements or regressions noted for tsvgx or tp4m.
Autophone
Throbber Start / Throbber Stop
Browser startup performance is measured on real phones (a variety of popular devices).
For the first time on this blog, I’ve pulled this graph from Perfherder, rather than phonedash. A wealth of throbber start/throbber stop data is now available in Perfherder. Here’s a quick summary for the local blank page test on various devices:
See bug 953342 to track autophone throbber regressions.
One of the first projects I worked on when I moved to the MozReview team was “review delegation”. The goal was to add the ability for a reviewer to redirect a review request to someone else. It turned out to be a change that was much more complicated than expected.
MozReview is a Mozilla developed extension to the open source Review Board product; with the primary focus on working with changes as a series of commits instead of as a single unified diff. This requires more than just a Review Board extension, it also encompasses a review repository (where reviews are pushed to), as well as Mercurial and Git modules that drive the review publishing process. Autoland is also part of our ecosystem, with work started on adding static analysis (eg. linters) and other automation to improve the code review workflow.
I inherited the bug with a patch that had undergone a single review. The patch worked by exposing the reviewers edit field to all users, and modifying the review request once the update was OK’d. This is mostly the correct approach, however it had two major issues:
According to Review Board and Bugzilla, the change was always made by the review’s submitter, not the person who actually made the change
Unlike other changes made in Review Board, the review request was updated immediately instead of using a draft which could then be published or discarded
Permissions
Review Board has a simple permissions model – the review request’s submitter (aka patch author) can make any change, while the reviewers can pretty much only comment, raise issues, and mark a review as “ready to ship” / “fix it”. As you would expect, there are checks within the object layer to ensure that these permission boundaries are not overstepped. Review Board’s extension system allows for custom authorisation and permissions check, however the granularity of these are course: you can only control if a user can edit a review request as a whole, not on a per-field level.
In order to allow the reviewer list to be changed, we need to tell Review Board that the submitter was making the change.
Performing the actions as the submitter instead of the authenticated user is easy enough, however when the changes were pushed to Bugzilla they were attributed to the wrong user. After a few false starts, I settled on storing the authenticated user in the request’s meta data, performing the changes as the submitter, and updating the routines that touch Bugzilla to first check for a stored user and make changes as that user instead of the submitter. Essentially “su”.
This worked well except for on the page where the meta data changes are displayed – here the change was incorrectly attributed to the review submitter. Remember that under Review Board’s permissions model only the review submitter can make these changes, so the name and gravatar were hard-coded in the django template to use the submitter. Given the constraints a Review Board extension has to operate in, this was a problem, and developing a full audit trail for Review Board would be too time consuming and invasive. The solution I went with was simple: hide the name and gravatar using CSS.
Drafts and Publishing
How Review Board works is, when you make a change, a draft is (almost) always created which you can then publish or discard. Under the hood this involves duplicating the review request into a draft object, against which modifications are made. A review request can only have one draft, which isn’t a problem because only the submitter can change the review.
Of course for reviewer delegation to work we needed a draft for each user. Tricky.
The fix ended up needing to take a different approach depending on if the submitter was making the change or not.
When the review submitter updates the reviewers, the normal review board draft is used, with a few tweaks that show the draft banner when viewing any revision in the series instead of just the one that was changed. This allows us to correctly cope with situations where the submitter makes changes that are broader than just the reviewers, such as pushing a revised patch, or attaching a screenshot.
When anyone else updates the reviewers, a “draft” is created in local storage in their browser, and a fake draft banner is displayed. Publishing from this fake draft banner calls the API endpoint that performs the permissions shenanigans mentioned earlier.
Overall it has been an interesting journey into how Review Board works, and highlighted some of the complications MozReview hits when we need to work against Review Board’s design. We’ve been working with the Review Board team to ease some of these issues, as well as deviating where required to deliver a Mozilla-focused user experience.
Last week, all of Mozilla met in London for a whirlwind tour from TARDIS to TaskCluster, from BBC1 to e10s, from Regent Park to the release train, from Paddington to Positron. As an Outreachy intern, I felt incredibly lucky to be part of this event, which gave me a chance to get to know Mozilla, my team, and the other interns much better. It was a jam-packed work week of talks, meetings, team events, pubs, and parties, and it would be impossible to blog about all of the fun, fascinating, and foxy things I learned and did. But I can at least give you some of the highlights! Or, should I say, Who-lights? (Be warned, that is not the last pun you will encounter here today.)
While watching the plenary session that kicked off the week, it felt great to realize that of the 4 executives emerging from the TARDIS in the corner to take the stage (3 Mozillians and 1 guest star), a full 50% were women. As I had shared with my mentor (also a woman) before arriving in London, one of my goals for the week was to get inspired by finding some new role moz-els (ha!): Mozillians who I could aspire to be like one day, especially those of the female variety.
Why a female role model, specifically? What does gender have to do with it?
Well, to be a good role model for you, a person needs to not only have a life/career/lego-dragon you aspire to have one day, but also be someone who you can already identify with, and see yourself in, today. A role model serves as a bridge between the two. As I am a woman, and that is a fundamental part of my experience, a role model who shares that experience is that much easier for me to relate to. I wouldn’t turn down a half-Irish-half-Indian American living in Germany, either.
At any rate, in London I found no shortage of talented, experienced, and - perhaps most importantly - valuedwomen at Mozilla. I don’t want to single anyone out here, but I can tell you that I met women at all levels of the organization, from intern to executive, who have done and are doing really exciting things to advance both the technology and culture of Mozilla and the web. Knowing that those people exist, and that what they do is possible, might be the most valuable thing I took home with me from London.
Electrolysis, or “e10s” for those who prefer integers to morphemes, is a massive and long-running initiative to separate the work Firefox does into multiple processes.
At the moment, the Firefox desktop program that the average user downloads and uses to explore the web runs in a single process. That means that one process has to do all the work of loading & displaying web pages (the browser “content”), as well as the work of displaying the user interface and its various tabs, search bars, sidebars, etc. (the browser “chrome”). So if something goes wrong with, say, the execution of a poorly-written script on a particular page, instead of only that page refusing to load, or its tab perhaps crashing, the entire browser itself may hang or crash.
That’s not cool. Especially if you often have lots of tabs open. Not that I ever do.
Of course not. Anyway, even less cool is the possibility that some jerk (not that there are any of those on the internet, though, right?) could make a page with a script that hijacks the entire browser process, and does super uncool stuff.
It would be much cooler if, instead of a single massive process, Firefox could use separate processes for content and chrome. Then, if a page crashes, at least the UI still works. And if we assign the content process(es) reduced permissions, we can keep possibly-jerkish content in a nice, safe sandbox so that it can’t do uncool things with our browser or computer.
It’s not perfect yet - for example, compatibility with right-to-left languages, accessibility (or “a11y”, if “e10s” needs a buddy), and add-ons is still an issue - but it’s getting there, and it’s rolling out real soon! Given that the project has been underway since 2008, that’s pretty exciting.
Rust, Servo, & Oxidation
I first heard about the increasingly popular language Rust when I was at the Recurse Center last fall, and all I knew about it was that it was being used at Mozilla to develop a new browser engine called Servo.
More recently, I heard talks from Mozillians like E. Dunham that revealed a bit more about why people are so excited about Rust: it’s a new language for low-level programming, and compared with the current mainstay C, it guarantees memory safety. As in, “No more segfaults, no more NULLs, no more dangling pointers’ dirty looks”. It’s also been designed with concurrency and thread safety in mind, so that programs can take better advantage of e.g. multi-core processors. (Do not ask me to get into details on this; the lowest level I have programmed at is probably sitting in a beanbag chair. But I believe them when they say that Rust does those things, and that those things are good.)
OK OK OK, so Rust is a super cool new language. What can you do with it?
Well, lots of stuff. For example, you could write a totally new browser engine, and call it Servo.
Wait, what’s a browser engine?
A browser engine (aka layout or rendering engine) is basically the part of a browser that allows it to show you the web pages you navigate to. That is, it takes the raw HTML and CSS content of the page, figures out what it means, and turns it into a pretty picture for you to look at.
Uh, I’m pretty sure I can see web pages in Firefox right now. Doesn’t it already have an engine?
Indeed it does. It’s called Gecko, and it’s written in C++. It lets Firefox make the web beautiful every day.
So why Servo, then? Is it going to replace Gecko?
No. Servo is an experimental engine developed by Mozilla Research; it’s just intended to serve(-o!) as a playground for new ideas that could improve a browser’s performance and security.
The beauty of having a research project like Servo and a real-world project like Gecko under the same roof at Mozilla is that when the Servo team’s research unveils some new and clever way of doing something faster or more awesomely than Gecko does, everybody wins! That’s thanks to the Oxidation project, which aims to integrate clever Rust components cooked up in the Servo lab into Gecko. Apparently, Firefox 45 already got (somewhat unexpectedly) an MP4 metadata parser in Rust, which has been running just fine so far. It’s just the tip of the iceberg, but the potential for cool ideas from Servo to make their way into Gecko via Oxidation is pretty exciting.
The Janitor
Another really exciting thing I heard about during the week is The Janitor, a tool that lets you contribute to FOSS projects like Firefox straight from your browser.
For me, one of the biggest hurdles to contributing to a new open-source project is getting the development environment all set up.
Ugh I hate that. I just want to change one line of code, do I really need to spend two days grappling with installation and configuration?!?
Powered by the very cool Cloud9 IDE, the Janitor gives you one-click access to a ready-to-go, cloud-based development environment for a given project. At the moment there are a handful of project supported (including Firefox, Servo, and Google Chrome), and new ones can be added by simply writing a Dockerfile. I’m not sure that an easier point of entry for new FOSS contributors is physically possible. The ease of start-up is perfect for short-term contribution efforts like hackathons or workshops, and thanks to the collaborative features of Cloud9 it’s also perfect for remote pairing.
Awesome, I’m sold. How do I use it?
Unfortunately, the Janitor is still in alpha and invite-only, but you can go to janitor.technology and sign up to get on the waitlist. I’m still waiting to get my invite, but if it’s half as fantastic as it seems, it will be a huge step forward in making it easier for new contributors to get involved with FOSS projects. If it starts supporting offline work (apparently the Cloud9 editor is somewhat functional offline already, once you’ve loaded the page initially, but the terminal and VNC always needs a connection to function), I think it’ll be unstoppable.
L20n
The last cool thing I heard about (literally, it was the last session on Friday) at this work week was L20n.
Wait, I thought “localization” was abbreviated “L10n”?
Yeah, um, that’s the whole pun. Way to be sharp, exhausted-from-a-week-of-talks-Anjana.
See, L20n is a next-generation framework for web and browser localization (l10n) and internationalization (i18n). It’s apparently a long-running project too, born out of the frustrations of the l10n status quo.
According to the L20n team, at the moment the localization system for Firefox is spread over multiple files with multiple syntaxes, which is no fun for localizers, and multiple APIs, which is no fun for developers. What we end up with is program logic intermingling with l10n/i18n decisions (say, determining the correct format for a date) such that developers, who probably aren’t also localizers, end up making decisions about language that should really be in the hands of the localizers. And if a localizer makes a syntax error when editing a certain localization file, the entire browser refuses to run. Not cool.
Pop quiz: what’s cool?
Um…
C’mon, we just went over this. Go on and scroll up.
Electrolyis?
Yeah, that’s cool, but thinking more generally…
Separation?
That’s right! Separation is super cool! And that’s what L20n does: separate l10n code from program source code. This way, developers aren’t pretending to be localizers, and localizers aren’t crashing browsers. Instead, developers are merely getting localized strings by calling a single L20n API, and localizers are providing localized strings in a single file format & syntax.
Wait but, isn’t unifying everything into a single API/file format the opposite of separation? Does that mean it’s not cool?
Shhh. Meaningful separation of concerns is cool. Arbitrary separation of a single concern (l10n) is not cool. L20n knows the difference.
OK, fine. But first “e10s” and “a11y”, now “l10n”/”l20n” and “i18n”… why does everything need a numbreviation?
This post brought to you from Mozilla’s London All Hands meeting - cheers!
When writing Python unit tests, sometimes you want to just test one specific aspect of a piece of code that does multiple things.
For example, maybe you’re wondering:
Does object X get created here?
Does method X get called here?
Assuming method X returns Y, does the right thing happen after that?
Finding the answers to such questions is super simple if you use mock: a library which “allows you to replace parts of your system under test with mock objects and make assertions about how they have been used.” Since Python 3.3 it’s available simply as unittest.mock, but if you’re using an earlier Python you can get it from PyPI with pip install mock.
So, what are mocks? How do you use them?
Well, in short I could tell you that a Mock is a sort of magical object that’s intended to be a doppelgänger for some object in your code that you want to test. Mocks have special attributes and methods you can use to find out how your test is using the object you’re mocking. For example, you can use Mock.called and .call_count to find out if and how many times a method has been called. You can also manipulate Mocks to simulate functionality that you’re not directly testing, but is necessary for the code you’re testing. For example, you can set Mock.return_value to pretend that an function gave you some particular output, and make sure that the right thing happens in your program.
But honestly, I don’t think I could give a better or more succinct overview of mocks than the Quick Guide, so for a real intro you should go read that. While you’re doing that, I’m going to watch this fantastic Michael Jackson video:
Oh you’re back? Hi! So, now that you have a basic idea of what makes Mocks super cool, let me share with you some of the tips/tips/trials/tribulations I discovered when starting to use them.
Patches and namespaces
tl;dr: Learn where to patch if you don’t want to be sad!
When you import a helper module into a module you’re testing, the tested module gets its own namespace for the helper module. So if you want to mock a class from the helper module, you need to mock it within the tested module’s namespace.
For example, let’s say I have a Super Useful helper module, which defines a class HelperClass that is So Very Helpful:
And in the module I want to test, tested, I instantiate the Incredibly Helpful HelperClass, which I imported from helper.py:
# tested.py

from helper import HelperClass

def fn():
    h = HelperClass() # using tested.HelperClass
    return h.help()
Now, let’s say that it is Incredibly Important that I make sure that a HelperClass object is actually getting created in tested, i.e. that HelperClass() is being called. I can write a test module that patches HelperClass, and check the resulting Mock object’s called property. But I have to be careful that I patch the right HelperClass! Consider test_tested.py:
# test_tested.py

import tested

from mock import patch

# This is not what you want:
@patch('helper.HelperClass')
def test_helper_wrong(mock_HelperClass):
    tested.fn()
    assert mock_HelperClass.called # Fails! I mocked the wrong class, am sad :(

# This is what you want:
@patch('tested.HelperClass')
def test_helper_right(mock_HelperClass):
    tested.fn()
    assert mock_HelperClass.called # Passes! I am not sad :)
OK great! If I patch tested.HelperClass, I get what I want.
But what if the module I want to test uses import helper and helper.HelperClass(), instead of from helper import HelperClass and HelperClass()? As in tested2.py:
In this case, in my test for tested2 I need to patch the class with patch('helper.HelperClass') instead of patch('tested.HelperClass'). Consider test_tested2.py:
# test_tested2.py

import tested2
from mock import patch

# This time, this IS what I want:
@patch('helper.HelperClass')
def test_helper_2_right(mock_HelperClass):
    tested2.fn()
    assert mock_HelperClass.called # Passes! I am not sad :)

# And this is NOT what I want!
# Mock will complain: "module 'tested2' does not have the attribute 'HelperClass'"
@patch('tested2.HelperClass')
def test_helper_2_right(mock_HelperClass):
    tested2.fn()
    assert mock_HelperClass.called
Wonderful!
In short: be careful of which namespace you’re patching in. If you patch whatever object you’re testing in the wrong namespace, the object that’s created will be the real object, not the mocked version. And that will make you confused and sad.
I was confused and sad when I was trying to mock the TestManifest.active_tests() function to test BaseMarionetteTestRunner.add_test, and I was trying to mock it in the place it was defined, i.e. patch('manifestparser.manifestparser.TestManifest.active_tests').
Instead, I had to patch TestManifestwithin the runner.base module, i.e. the place where it was actually being called by the add_test function, i.e. patch('marionette.runner.base.TestManifest.active_tests').
So don’t be confused or sad, mock the thing where it is used, not where it was defined!
Pretending to read files with mock_open
One thing I find particularly annoying is writing tests for modules that have to interact with files. Well, I guess I could, like, write code in my tests that creates dummy files and then deletes them, or (even worse) just put some dummy files next to my test module for it to use. But wouldn’t it be better if I could just skip all that and pretend the files exist, and have whatever content I need them to have?
It sure would! And that’s exactly the type of thing mock is really helpful with. In fact, there’s even a helper called mock_open that makes it super simple to pretend to read a file. All you have to do is patch the builtin open function, and pass in mock_open(read_data="my data") to the patch to make the open in the code you’re testing only pretend to open a file with that content, instead of actually doing it.
To see it in action, you can take a look at a (not necessarily great) little test I wrote that pretends to open a file and read some data from it:
def test_nonJSON_file_throws_error(runner):
    with patch('os.path.exists') as exists:
        exists.return_value = True
        with patch('__builtin__.open', mock_open(read_data='[not {valid JSON]')):
            with pytest.raises(Exception) as json_exc:
                runner._load_testvars() # This is the code I want to test, specifically to be sure it throws an exception
    assert 'not properly formatted' in json_exc.value.message
Gotchya: Mocking and debugging at the same time
See that patch('os.path.exists') in the test I just mentioned? Yeah, that’s probably not a great idea. At least, I found it problematic.
I was having some difficulty with a similar test, in which I was also patching os.path.exists to fake a file (though that wasn’t the part I was having problems with), so I decided to set a breakpoint with pytest.set_trace() to drop into the Python debugger and try to understand the problem. The debugger I use is pdb++, which just adds some helpful little features to the default pdb, like colors and sticky mode.
So there I am, merrily debugging away at my (Pdb++) prompt. But as soon as I entered the patch('os.path.exists') context, I started getting weird behavior in the debugger console: complaints about some ~/.fancycompleterrc.py file and certain commands not working properly.
It turns out that at least one module pdb++ was using (e.g. fancycompleter) was getting confused about file(s) it needs to function, because of checks for os.path.exists that were now all messed up thanks to my ill-advised patch. This had me scratching my head for longer than I’d like to admit.
What I still don’t understand (explanations welcome!) is why I still got this weird behavior when I tried to change the test to patch 'mymodule.os.path.exists' (where mymodule.py contains import os) instead of just 'os.path.exists'. Based on what we saw about namespaces, I figured this would restrict the mock to only mymodule, so that pdb++ and related modules would be safe - but it didn’t seem to have any effect whatsoever. But I’ll have to save that mystery for another day (and another post).
Still, lesson learned: if you’re patching a commonly used function, like, say, os.path.exists, don’t forget that once you’re inside that mocked context, you no longer have access to the real function at all! So keep an eye out, and mock responsibly!
Mock the night away
Those are just a few of the things I’ve learned in my first few weeks of mocking. If you need some bedtime reading, check out these resources that I found helpful:
I’m sure mock has all kinds of secrets, magic, and superpowers I’ve yet to discover, but that gives me something to look forward to! If you have mock-foo tips to share, just give me a shout on Twitter!
When it comes to version control, I’m a Git girl. I had to use Subversion a little bit for a project in grad school (not distributed == not so fun). But I had never touched Mercurial until I decided to contribute to Mozilla’s Marionette, a testing tool for Firefox, for my Outreachy application. Mercurial is the main version control system for Firefox and Marionette development,1 so this gave me a great opportunity to start learning my way around the hg. Turns out it’s really close to Git, though there are some subtle differences that can be a little tricky. This post documents the basics and the trip-ups I discovered. Although there’s plenty of otherinfooutthere, I hope some of this might be helpful for others (especially other Gitters) using Mercurial or contributing to Mozilla code for the first time. Ready to heat things up? Let’s do this!
Getting my bearings on Planet Mercury
OK, so I’ve been working through the Firefox Onramp to install Mercurial (via the bootstrap script) and clone the mozilla-central repository, i.e. the source code for Firefox. This is just like Git; all I have to do is:
$ hg clone <repo>
(Incidentally, I like to pronounce the hg command “hug”, e.g. “hug clone”. Warm fuzzies!)
Cool, I’ve set foot on a new planet! …But where am I? What’s going on?
Just like in Git, I can find out about the repo’s history with hg log. Adding some flags make this even more readable: I like to --limit the number of changesets (change-whats? more on that later) displayed to a small number, and show the --graph to see how changes are related. For example:
$ hg log --graph --limit 5
or, for short:
$ hg log -Gl5
This outputs something like:
@    changeset:   300339:e27fe24a746f
|\   tag:         tip
| ~  fxtree:      central
|    parent:      300125:718e392bad42
|    parent:      300338:8b89d98ce322
|    user:        Carsten "Tomcat" Book <cbook@mozilla.com>
|    date:        Fri Jun 03 12:00:06 2016 +0200
|    summary:     merge mozilla-inbound to mozilla-central a=merge
|
o  changeset:   300338:8b89d98ce322
|  user:        Jean-Yves Avenard <jyavenard@mozilla.com>
|  date:        Thu Jun 02 21:08:05 2016 +1000
|  summary:     Bug 1277508: P2. Add HasPendingDrain convenience method. r=kamidphish
|
o  changeset:   300337:9cef6a01859a
|  user:        Jean-Yves Avenard <jyavenard@mozilla.com>
|  date:        Thu Jun 02 20:54:33 2016 +1000
|  summary:     Bug 1277508: P1. Don't attempt to demux new samples while we're currently draining. r=kamidphish
|
o  changeset:   300336:f75d7afd686e
|  user:        Jean-Yves Avenard <jyavenard@mozilla.com>
|  date:        Fri Jun 03 11:46:36 2016 +1000
|  summary:     Bug 1277729: Ignore readyState value when reporting the buffered range. r=jwwang
|
o  changeset:   300335:71a44348d3b7
|  user:        Jean-Yves Avenard <jyavenard@mozilla.com>
~  date:        Thu Jun 02 17:14:03 2016 +1000
   summary:     Bug 1276184: [MSE] P3. Be consistent with types when accessing track buffer. r=kamidphish
Great! Now what does that all mean?
Some (confusing) terminology
Changesets/revisions and their identifiers
According to the official definition, a changeset is “an atomic collection of changes to files in a repository.” As far as I can tell, this is basically what I would call a commit in Gitese. For now, that’s how I’m going to think of a changeset, though I’m sure there’s some subtle difference that’s going to come back to bite me later. Looking forward to it!
Changesets are also called revisions (because two names are better than one?), and each one has (confusingly) two identifying numbers: a local revision number (a small integer), and a global changeset ID (a 40-digit hexadecimal, more like Git’s commit IDs). These are what you see in the output of hg log above in the format:
changeset: <revision-number>:<changeset-ID>
For example,
changeset: 300339:e27fe24a746f
is the changeset with revision number 300339 (its number in my copy of the repo) and changeset ID e27fe24a746f (its number everywhere).
Why the confusing double-numbering? Well, apparently because revision numbers are “shorter to type” when you want to refer to a certain changeset locally on the command line; but since revision numbers only apply to your local copy of the repo and will “very likely” be different in another contributor’s local copy, you should only use changeset IDs when discussing changes with others. But on the command line I usually just copy-paste the hash I want, so length doesn’t really matter, so… I’m just going to ignore revision numbers and always use changeset IDs, OK Mercurial? Cool.
Branches, bookmarks, heads, and the tip
I know Git! I know what a “branch” is! - Anjana, learning Mercurial
Yeeeah, about that… Unfortunately, this term in Gitese is a false friend of its Mercurialian equivalent.
In the land of Gitania, when it’s time to start work on a new bug/feature, I make a new branch, giving it a feature-specific name; do a bunch of work on that branch, merging in master as needed; then merge the branch back into master whenever the feature is complete. I can make as many branches as I want, whenever I want, and give them whatever names I want.
This is because in Git, a “branch” is basically just a pointer (a reference or “ref”) to a certain commit, so I can add/delete/change that pointer whenever and however I want without altering the commit(s) at all. But on Mercury, a branch is simply a “diverged” series of changesets; it comes to exist simply by virtue of a given changeset having multiple children, and it doesn’t need to have a name. In the output of hg log --graph, you can see the branches on the left hand side: continuation of a branch looks like |, merging |\, and branching |/. Here are some examples of what that looks like.
Confusingly, Mercuial also has named branches, which are intended to be longer-lived than branches in Git, and actually become part of a commit’s information; when you make a commit on a certain named branch, that branch is part of that commit forever. This post has a pretty good explanation of this.
Luckily, Mercurial does have an equivalent to Git’s branches: they’re called bookmarks. Like Git branches, Mercurial bookmarks are just handy references to certain commits. I can create a new one thus:
$ hg bookmark my-awesome-bookmark
When I make it, it will point to the changeset I’m currently on, and if I commit more work, it will move forward to point to my most recent changeset. Once I’ve created a bookmark, I can use its name pretty much anywhere I can use a changeset ID, to refer to the changeset the bookmark is pointing to: e.g. to point to the bookmark I can do hg up my-awesome-bookmark. I can see all my bookmarks and the changesets they’re pointing to with the command:
When I’m on a bookmark, it’s “active”; the currently active bookmark is indicated with a *.
OK, maybe I was wrong about branches, but at least I know what the “HEAD” is! - Anjana, a bit later
Yeah, nope. I think of the “HEAD” in Git as the branch (or commit, if I’m in “detached HEAD” state) I’m currently on, i.e. a pointer to (the pointer to) the commit that would end up the parent of whatever I commit next. In Mercurial, this doesn’t seem to have a special name like “HEAD”, but it’s indicated in the output of hg log --graph by the symbol @. However, Mercurial documentation does talk about heads, which are just the most recent changesets on all branches (regardless of whether those branches have names or bookmarks pointing to them or not).2 You can see all those with the command hg heads.
The head which is the most recent changeset, period, gets a special name: the tip. This is another slight difference from Git, where we can talk about “the tip of a branch”, and therefore have several tips. In Mercurial, there is only one. It’s labeled in the output of hg log with tag: tip.
the most recent changeset in the entire history (regardless of branch structure)
All the world’s a stage (but Mercury’s not the world)
Just like with Git, I can use hg status to see the changes I’m about to commit before committing with hg commit. However, what’s missing is the part where it tells me which changes are staged, i.e. “to be committed”. Turns out the concept of “staging” is unique to Git; Mercurial doesn’t have it. That means that when you type hg commit, any changes to any tracked files in the repo will be committed; you don’t have to manually stage them like you do with git add <file> (hg add <file> is only used to tell Mercurial to track a new file that it’s not tracking yet).
However, just like you can use git add --patch to stage individual changes to a certain file a la carte, you can use the now-standard record extension to commit only certain files or parts of files at a time with hg commit --interactive. I haven’t yet had occasion to use this myself, but I’m looking forward to it!
Turning back time
I can mess with my Mercurial history in almost exactly the same way as I would in Git, although whereas this functionality is built in to Git, in Mercurial it’s accomplished by means of extensions. I can use the rebase extension to rebase a series of changesets (say, the parents of the active bookmark location) onto a given changeset (say, the latest change I pulled from central) with hg rebase, and I can use the hg histedit command provided by the histedit extension to reorder, edit, and squash (or “fold”, to use the Mercurialian term) changesets like I would with git rebase --interactive.
My Mozilla workflow
In my recent work refactoring and adding unit tests for Marionette’s Python test runner, I use a workflow that goes something like this.
I’m gonna start work on a new bug/feature, so first I want to make a new bookmark for work that will branch off of central:
$ hg up central
$ hg bookmark my-feature
Now I go ahead and do some work, and when I’m ready to commit it I simply do:
$ hg commit
which opens my default editor so that I can write a super great commit message. It’s going to be informative and formatted properly for MozReview/Bugzilla, so it might look something like this:
Bug 1275269 - Add tests for _add_tests; r?maja_zf

Add tests for BaseMarionetteTestRunner._add_tests:
Test that _add_tests populates self.tests with correct tests;
Test that invalid test names cause _add_tests to
throw Exception and report invalid names as expected.
After working for a while, it’s possible that some new changes have come in on central (this happens about daily), so I may need to rebase my work on top of them. I can do that with:
$ hg pull central
followed by:
$ hg rebase -d central
which rebases the commits in the branch that my bookmark points to onto the most recent changeset in central. Note that this assumes that the bookmark I want to rebase is currently active (I can check if it is with hg bookmarks).
Then maybe I commit some more work, so that now I have a series of commits on my bookmark. But perhaps I want to reorder them, squash some together, or edit commit messages; no problemo, I just do a quick:
$ hg histedit
which opens a history listing all the changesets on my bookmark. I can edit that file to pick, fold (squash), or edit changesets in pretty much the same way I would using git rebase --interactive.
My special Mozillian configuration of Mercurial, which a wizard helped me set up during installation, magically prepares everything for MozReview and then asks me if I want to
publish these review requests now (Yn)?
To which I of course say Y (or, you know, realize I made a horrible mistake, say n, go back and re-do everything, and then push to review again).
Then I just wait for review feedback from my mentor, and perhaps make some changes and amend my commits based on that feedback, and push those to review again.
Ultimately, once the review has passed, my changes get merged into mozilla-inbound, then eventually mozilla-central (more on what that all means in a future post), and I become an official contributor. Yay! :)
So is this goodbye Git?
Nah, I’ll still be using Git as my go-to version control system for my own projects, and another Mozilla project I’m contributing to, Perfherder, has its code on Github, so Git is the default for that.
But learning to use Mercurial, like learning any new tool, has been educational! Although my progress was (and still is) a bit slow as I get used to the differences in features/workflow (which, I should reiterate, are quite minor when coming from Git), I’ve learned a bit more about version control systems in general, and some of the design decisions that have gone into these two. Plus, I’ve been able to contribute to a great open-source project! I’d call that a win. Thanks Mercurial, you deserve a hg. :)
1 However, there is a small but ardent faction of Mozilla devs who refuse to stop using Git. Despite being a Gitter, I chose to forego this option and use Mercurial because a) it’s the default, so most of the documentation etc. assumes it’s what you’re using, and b) I figured it was a good chance to get to know a new tool. ↩
2 Git actually uses this term the same way; the tips of all branches are stored in .git/refs/heads. But in my experience the term “heads” doesn’t pop up as often in Git as in Mercurial. Maybe this is because in Git we can talk about “branches” instead? ↩
Hello from Platforms Operations! Once a month we highlight one of our projects to help the Mozilla community discover a useful tool or an interesting contribution opportunity.
This month’s project is firefox-ui-tests!
What are firefox-ui-tests?
Firefox UI tests are a test suite for integration tests which are based on the Marionette automation framework and are majorly used for user interface centric testing of Firefox. The difference to pure Marionette tests is, that Firefox UI tests are interacting with the chrome scope (browser interface) and not content scope (websites) by default. Also the tests have access to a page object model called Firefox Puppeteer. It eases the interaction with all ui elements under test, and especially makes interacting with the browser possible even across different localizations of Firefox. That is a totally unique feature compared to all the other existing automated test suites.
Where Firefox UI tests are used
As of today the Firefox UI functional tests are getting executed for each code check-in on integration and release branches, but limited to Linux64 debug builds due to current Taskcluster restrictions. Once more platforms are available the testing will be expanded appropriately.
But as mentioned earlier we also want to test localized builds of Firefox. To get there the developer, and release builds, for which all locales exist, have to be used. Those tests run in our own CI system called mozmill-ci which is driven by Jenkins. Due to a low capacity of test machines only a handful of locales are getting tested. But this will change soon with the complete move to Taskcluster. With the CI system we also test updates of Firefox to ensure that there is no breakage for our users after an update.
What are we working on?
The current work is fully dedicated to bring more visibility of our test results to developers. We want to get there with the following sub projects:
Bug 1272228 – Get test results out of the by default hidden Tier-3 level on Treeherder and make them reporting as Tier-2 or even Tier-1. This will drastically reduce the number of regressions introduced for our tests.
Bug 1272145 – Tests should be located close to the code which actually gets tested. So we want to move as many Firefox UI tests as possible from testing/firefox-ui-tests/tests to individual browser or toolkit components.
Bug 1272236 – To increase stability and coverage of Firefox builds including all various locales, we want to get all of our tests for nightly builds on Linux64 executed via TaskCluster.
How to run the tests
The tests are located in the Firefox development tree. That allows us to keep them up-to-date when changes in Firefox are introduced. But that also means that before the tests can be executed a full checkout of mozilla-central has to be made. Depending on the connection it might take a while… so take the chance to grab a coffee while waiting.
When the Firefox build is available the tests can be run. A tool which allows a simple invocation of the tests is called mach and it is located in the root of the repository. Call it with various arguments to run different sets of tests or a different binary. Here some examples:
# Run integration tests with the Firefox you built

./mach firefox-ui-functional
# Run integration tests with a downloaded Firefox

./mach firefox-ui-functional --binary %path%
# Run update tests with an older downloaded Firefox

./mach firefox-ui-update --binary %path%
There are some more arguments available. For an overview consult our MDN documentation or run eg. mach firefox-ui-functional --help.
If the above sounds interesting to you, and you are willing to learn more about test automation, the firefox-ui-tests project is definitely a good place to get started. We have a couple of open mentored bugs, and can create even more, depending on individual requirements and knowledge in Python.
Today was my first day as an Outreachy intern with Mozilla! What does that even mean? Why is it super exciting? How did I swing such a sweet gig? How will I be spending my summer non-vacation? Read on to find out!
What is Outreachy?
Outreachy is a fantastic initiative to get more women and members of other underrepresented groups involved in Free & Open Source Software. Through Outreachy, organizations that create open-source software (e.g. Mozilla, GNOME, Wikimedia, to name a few) take on interns to work full-time on a specific project for 3 months. There are two internship rounds each year, May-August and December-March. Interns are paid for their time, and receive guidance/supervision from an assigned mentor, usually a full-time employee of the organization who leads the given project.
Oh yeah, and the whole thing is done remotely! For a lot of people (myself included) who don’t/can’t/won’t live in a major tech hub, the opportunity to work remotely removes one of the biggest barriers to jumping in to the professional tech community. But as FOSS developers tend to be pretty distributed anyway (I think my project’s team, for example, is on about 3 continents), it’s relatively easy for the intern to integrate with the team. It seems that most communication takes place over IRC and, to a lesser extent, videoconferencing.
What does an Outreachy intern do?
Anything and everything! Each project and organization is different. But in general, interns spend their time…
Coding (or not)
A lot of projects involve writing code, though what that actually entails (language, framework, writing vs. refactoring, etc.) varies from organization to organization and project to project. However, there are also projects that don’t involve code at all, and instead have the intern working on equally important things like design, documentation, or community management.
As for me specifically, I’ll be working on the project Test-driven Refactoring of Marionette’s Python Test Runner. You can click through to the project description for more details, but basically I’ll be spending most of the summer writing Python code (yay!) to test and refactor a component of Marionette, a tool that lets developers run automated Firefox tests. This means I’ll be learning a lot about testing in general, Python testing libraries, the huge ecosystem of internal Mozilla tools, and maybe a bit about browser automation. That’s a lot! Luckily, I have my mentor Maja (who happens to also be an alum of both Outreachy and RC!) to help me out along the way, as well as the other members of the Engineering Productivity team, all of whom have been really friendly & helpful so far.
Traveling
Interns receive a $500 stipend for travel related to Outreachy, which is fantastic. I intend, as I’m guessing most do, to use this to attend conference(s) related to open source. If I were doing a winter round I would totally use it to attend FOSDEM, but there are also a ton of conferences in the summer! Actually, you don’t even need to do the traveling during the actual 3 months of the internship; they give you a year-long window so that if there’s an annual conference you really want to attend but it’s not during your internship, you’re still golden.
At Mozilla in particular, interns are also invited to a week-long all-hands meet up! This is beyond awesome, because it gives us a chance to meet our mentors and other team members in person. (Actually, I doubly lucked out because I got to meet my mentor at RC during “Never Graduate Week” a couple of weeks ago!)
Blogging
One of the requirements of the internship is to blog regularly about how the internship and project are coming along. This is my first post! Though we’re required to write a post every 2 weeks, I’m aiming to write one per week, on both technical and non-technical aspects of the internship. Stay tuned!
How do you get in?
I’m sure every Outreachy participant has a different journey, but here’s a rough outline of mine.
Step 1: Realize it is a thing
Let’s not forget that the first step to applying for any program/job/whatever is realizing that it exists! Like most people, I think, I had never heard of Outreachy, and was totally unaware that a remote, paid internship working on FOSS was a thing that existed in the universe. But then, in the fall of 2015, I made one of my all-time best moves ever by attending the Recurse Center (RC), where I soon learned about Outreachy from various Recursers who had been involved with the program. I discovered it about 2 weeks before applications closed for the December-March 2015-16 round, which was pretty last-minute; but a couple of other Recursers were applying and encouraged me to do the same, so I decided to go for it!
Step 2: Frantically apply at last minute
Applying to Outreachy is a relatively involved process. A couple months before each round begins, the list of participating organizations/projects is released. Prospective applicants are supposed to find a project that interests them, get in touch with the project mentor, and make an initial contribution to that project (e.g. fix a small bug).
But each of those tasks is pretty intimidating!
First of all, the list of participating organizations is long and varied, and some organizations (like Mozilla) have tons of different projects available. So even reading through the project descriptions and choosing one that sounds interesting (most of them do, at least to me!) is no small task.
Then, there’s the matter of mustering up the courage to join the organization/project’s IRC channel, find the project mentor, and talk to them about the application. I didn’t even really know what IRC was, and had never used it before, so I found this pretty scary. Luckily, I was RC, and one of my batchmates sat me down and walked me through IRC basics.
However, the hardest and most important part is actually making a contribution to the project at hand. Depending on the project, this can be long & complicated, quick & easy, or anything in between. The level of guidance/instruction also varies widely from project to project: some are laid out clearly in small, hand-holdy steps, others are more along the lines of “find something to do and then do it”. Furthermore, prerequisites for making the contribution can be anything from “if you know how to edit text and send an email, you’re fine” to “make a GitHub account” to “learn a new programming language and install 8 million new tools on your system just to set up the development environment”. All in all, this means that making that initial contribution can often be a deceptively large amount of work.
Because of all these factors, for my application to the December-March round I decided to target the Mozilla project “Contribute to the HTML standard”. In addition to the fact that I thought it would be awesome to contribute to such a fundamental part of the web, I chose it because the contribution itself was really simple: just choose a GitHub issue with a beginner-friendly label, ask some questions via GitHub comments, edit the source markup file as needed, and make a pull request. I was already familiar with GitHub so it was pretty smooth sailing.
Once you’ve made your contribution, it’s time to write the actual Outreachy application. This is just a plain text file you fill out with lots of information about your experience with FOSS, your contribution to the project, etc. In case it’s useful to anyone, here’s my application for the December-March 2015-16 round. But before you use that as an example, make sure you read what happened next…
Step 3: Don’t get in
Unfortunately, I didn’t get in to the December-March round (although I was stoked to see some of my fellow Recursers get accepted!). Honestly, I wasn’t too surprised, since my contributions and application had been so hectic and last-minute. But even though it wasn’t successful, the application process was educational in and of itself: I learned how to use IRC, got 3 of my first 5 GitHub pull requests merged, and became a contributor to the HTML standard! Not bad for a failure!
Step 4: Decide to go for it again (at last minute, again)
Fast forward six months: after finishing my batch at RC, I had been looking & interview-prepping, but still hadn’t gotten a job. When the applications for the May-August round opened up, I took a glance at the projects and found some cool ones, but decided that I wouldn’t apply this round because a) I needed a Real Job, not an internship, and b) the last round’s application process was a pretty big time investment which hadn’t paid off (although it actually had, as I just mentioned!).
But as the weeks went by, and the application deadline drew closer, I kept thinking about it. I was no closer to finding a Real Job, and upheaval in my personal life made my whereabouts over the summer an uncertainty (I seem never to know what continent I live on), so a paid, remote internship was becoming more and more attractive. When I broached my hesitation over whether or not to apply to other Recursers, they unanimously encouraged me (again) to go for it (again). Then, I found out that one of the project mentors, Maja, was a Recurser, and since her project was one of the ones I had shortlisted, I decided to apply for it.
Of course, by this point it was once again two weeks until the deadline, so panic once again set in!
Step 5: Learn from past mistakes
This time, the process as a whole was easier, because I had already done it once. IRC was less scary, I already felt comfortable asking the project mentor questions, and having already been rejected in the previous round made it somehow lower-stakes emotionally (“What the hell, at least I’ll get a PR or two out of it!”). During my first application I had spent a considerable amount of time reading about all the different projects and fretting about which one to do, flipping back and forth mentally until the last minute. This time, I avoided that mistake and was laser-focused on a single project: Test-driven Refactoring of Marionette’s Python Test Runner.
From a technical standpoint, however, contributing to the Marionette project was more complicated than the HTML standard had been. Luckily, Maja had written detailed instructions for prospective applicants explaining how to set up the development environment etc., but there were still a lot of steps to work through. Then, because there were so many folks applying to the project, there was actually a shortage of “good-first-bugs” for Marionette! So I ended up making my first contributions to a different but related project, Perfherder, which meant setting up a different dev environment and working with a different mentor (who was equally friendly). By the time I was done with the Perfherder stuff (which turned out to be a fun little rabbit hole!), Maja had found me something Marionette-specific to do, so I ended up working on both projects as part of my application process.
When it came time to write the actual application, I also had the luxury of being able to use my failed December-March application as both a starting point and an example of what not to do. Some of the more generic parts (my background, etc.) were reusable, which saved time. But when it came to the parts about my contribution to the project and my proposed internship timeline, I knew I had to do a much better job than before. So I opted for over-communciation, and basically wrote down everything I could think of about what I had already done and what I would need to do to complete the goals stated in the project description (which Maja had thankfully written quite clearly).
In the end, my May-August application was twice as long as my previous one had been. Much of that difference was the proposed timeline, which went from being one short paragraph to about 3 pages. Perhaps I was a bit more verbose than necessary, but I decided to err on the side of too many details, since I had done the opposite in my previous application.
Step 6: Get a bit lucky
Spoiler alert: this time I was accepted!
Although I knew I had made a much stronger application than in the previous round, I was still shocked to find out that I was chosen from what seemed to be a large, competitive applicant pool. I can’t be sure, but I think what made the difference the second time around must have been a) more substantial contributions to two different projects, b) better, more frequent communication with the project mentor and other team members, and c) a much more thorough and better thought-out application text.
But let’s not forget d) luck. I was lucky to have encouragement and support from the RC community throughout both my applications, lucky to have the time to work diligently on my application because I had no other full-time obligations, lucky to find a mentor who I had something in common with and therefore felt comfortable talking to and asking questions of, and lucky to ultimately be chosen from among what I’m sure were many strong applications. So while I certainly did work hard to get this internship, I have to acknowledge that I wouldn’t have gotten in without all of that luck.
Why am I doing this?
Last week I had the chance to attend OSCON 2016, where Mozilla’s E. Dunham gave a talk on How to learn Rust. A lot of the information applied to learning any language/new thing, though, including this great recommendation: When embarking on a new skill quest, record your motivation somewhere (I’m going to use this blog, but I suppose Twitter or a vision board or whatever would work too) before you begin.
The idea is that once you’re in the process of learning the new thing, you will probably have at least one moment where you’re stuck, frustrated, and asking yourself what the hell you were thinking when you began this crazy project. Writing it down beforehand is just doing your future self a favor, by saving up some motivation for a rainy day.
So, future self, let it be known that I’m doing Outreachy to…
Write code for an actual real-world project (as opposed to academic/toy projects that no one will ever use)
Get to know a great organization that I’ve respected and admired for years
Try out working remotely, to see if it suits me
Learn more about Python, testing, and automation
Gain confidence and feel more like a “real developer”
Launch my career in the software industry
I’m sure these goals will evolve as the internship goes along, but for now they’re the main things driving me. Now it’s just a matter of sitting back, relaxing, and working super hard all summer to achieve them! :D
Got any more questions?
Are you curious about Outreachy? Thinking of applying? Confused about the application process? Feel free to reach out to me! Go on, don’t be shy, just use one of those cute little contact buttons and drop me a line. :)
I recently got to spend a week back at the heart of an excellentdelightful inspiring technical community: Recurse Center or RC. This friendly group consists mostly of programmers from around the world who have, at some point, participated in RC’s three-month “retreat” in New York City to work on whatever projects happen to interest them. The retreat’s motto is “never graduate”, and so participants continue to support each other’s technical growth and curiosity forever and ever.
I’m an RC alum from 2014! RC’s retreat is how I ended up contributing to open source software and eventually gathering the courage to join Mozilla. Before RC, despite already having thousands of hours of programming and fancy math under my belt, I held myself back with doubts about whether I’m a “real programmer”, whatever that stereotype means. That subconscious negativity hasn’t magically disappeared, but I’ve had a lot of good experiences in the past few years to help me manage it. Today, RC helps me stay excited about learning all the things for the sake of learning all the things.
A retreat at RC looks something like this: you put your life more-or-less on hold, move to NYC, and spend three months tinkering in a big, open office with around fifty fellow (thoughtful, kind, enthusiastic) programmers. During my 2014 retreat, I worked mostly on lowish-level networking things in Python, pair programmed on whatever else people happened to be working on, gave and received code review, chatted with wise “residents”, attended spontaneous workshops, presentations and so on.
Every May, alumni are invited to return to the RC space for a week, and this year I got to go! (Thanks, Mozilla!) It was awesome! Exclamation points! This past week felt like a tiny version of the 3-month retreat. After two years away, I felt right at home — that says a lot about the warm atmosphere RC manages to cultivate. My personal goal for the week was just to work in a language that’s relatively new to me - JavaScript - but I also happened to have really interesting conversations about things like:
How to implement a basic debugger?
How to improve the technical interview process?
What holds developers back or slows them down? What unnecessary assumptions do we have about our tools and their limitations?
RC’s retreat is a great environment for growing as a developer, but I don’t want to make it sound like it’s all effortless whimsy. Both the hardest and most wonderful part of RC (and many other groups) is being surrounded by extremely impressive, positive people who never seem to struggle with anything. It’s easy to slip into showing off our knowledge or to get distracted by measuring ourselves against our peers. Sometimes this is impostor syndrome. Sometimes it’s the myth of the 10x developer. RC puts a lot of effort into being a safe space where you can reveal your ignorance and ask questions, but insecurity can always be a challenge.
Similarly, the main benefit of RC is learning from your peers, but the usual ways of doing this seem to be geared toward people who are outgoing and think out loud. These are valuable skills, but when we focus on them exclusively we don’t hear from people who have different defaults. There is also little structure provided by RC so you are free to self-organize and exchange ideas as you deem appropriate. The risk is that quiet people are allowed to hide in their quiet corners, and then everyone misses out on their contributions. I think RC makes efforts to balance this out, but the overall lack of structure means you really have to take charge of how you learn from others. I’m definitely better at this than I used to be.
RC is an experiment and it’s always changing. Although at this point my involvement is mostly passive, I’m glad to be a part of it. I love that I’ve been able to work closely with vastly different people, getting an inside look at their work habits and ways of thinking. Now, long after my “never-graduation”, the RC community continues to expose me to a variety of ideas about technology and learning in a way that makes us all get better. Continuous improvement, yeah!
All along I wanted to run some in-tree tests without having them wait around for a Firefox build or any other dependencies they don’t need. So I originally implemented this task as a “build” so that it would get scheduled for every incoming changeset in Mozilla’s repositories.
But forget “builds”, forget “tests” — now there’s a third category of tasks that we’ll call “generic” and it’s exactly what I need.
In base_jobs.yml I say, “hey, here’s a new task called marionette-harness — run it whenever there’s a change under (branch)/testing/marionette/harness”. Of course, I can also just trigger the task with try syntax like try: -p linux64_tc -j marionette-harness -u none -t none.
When the task is triggered, a chain of events follows:
harness_marionette.yml sets more environment variables and parameters for build.sh to use (JOB_SCRIPT, MOZHARNESS_SCRIPT, etc.)
So build.sh checks out the source tree and executes harness-test-linux.sh (JOB_SCRIPT)…
…which in turn executes marionette_harness_tests.py (MOZHARNESS_SCRIPT) with the parameters passed on by build.sh
For Tasks that Make Sense in a gecko Source Checkout
As you can see, I made the build.sh script in the desktop-build docker image execute an arbitrary in-tree JOB_SCRIPT, and I created harness-test-linux.sh to run mozharness within a gecko source checkout.
Why not the desktop-test image?
But we can also run arbitrary mozharness scripts thanks to the configuration in the desktop-test docker image! Yes, and all of that configuration is geared toward testing a Firefox binary, which implies downloading tools that my task either doesn’t need or already has access to in the source tree. Now we have a lighter-weight option for executing tests that don’t exercise Firefox.
Why not mach?
In my lazy work-in-progress, I had originally executed the Marionette harness tests via a simple call to mach, yet now I have this crazy chain of shell scripts that leads all the way mozharness. The mach command didn’t disappear — you can run Marionette harness tests with ./mach python-test .... However, mozharness provides clearer control of Python dependencies, appropriate handling of return codes to report test results to Treeherder, and I can write a job-specific script and configuration.
This conference was awesome: not too big, not too cramped of a schedule (long breaks between talk sessions), free drinks, snacks & meals (with vegan options!), unisex bathrooms (toiletries & tampons provided!), a code of conduct, and - most importantly, to me - a great diversity program that gave me and 16 others support to attend! The unconference format was really interesting, and worked better than I expected. It also enabled something I wasn’t planning on: I gave my first talk at a tech conference!
What’s an unconference?
There’s no pre-planned schedule; instead, at the beginning of each day, anyone who’s interested in giving a talk makes a short pitch of their topic, and for the next hour or so the rest of the attendees vote on which talks they want to attend. The highest-voted talks are selected, and begin shortly after that. It sounds like it would be chaos, but it works!
I gave my first tech talk! On 3 hours’ notice!
On day 2 of the conference, in a completely unexpected turn of events, I proposed, planned, and delivered a 30-minute talk within a period of about 3 hours. Am I crazy? Perhaps. But the good kind of crazy!
See, there had been some interest in functional programming in JS (as part of the unconference format, people can submit topics they’d like to hear a talk on as well), and some talks on specific topics related to functional languages/libraries, but no one had proposed a high-level general introduction about it. So, at literally the last minute of the talk-proposal session, I spontaneously got up and pitched “Learning Functional Programming with JS” (that’s how I learned FP, after all!).
Turns out people were indeed interested: my proposal actually got more votes than any other that day. Which meant that I would present in the main room, the only one out of the three tracks that was being recorded. So all I had to do was, you know, plan a talk and make slides from scratch and then speak for 30 minutes in front of a camera, all in the space of about 3 hours.
Yay! No, wait… panic!
Luckily my years of teaching experience and a few presentations at academic conferences came to the rescue. I had to skip a couple of the sessions before mine (luckily some talks were recorded), and get a little instant feedback from a few folks at the conference that I had gotten to know, but ultimately I was able to throw together a talk outline and some slides.
When it came to actually delivering the talk, it was actually less scary than I thought. I even had enough time to do an ad-hoc digression (on the chalkboard!!!) into persistent data structures, which are the topic of my first scheduled tech talk at !!Con 2016.
The whole thing was a great experience, and definitely gave me a huge confidence boost for speaking at more conferences in the future (look out, !!Con and EuroPython!). I would recommend it to anyone! Come to think of it, why aren’t you giving talks yet?
Some things I learned at JSUnconf
The unconference format is pretty sweet!
Giving a tech talk is not as scary as all that!
HTTP/2 is a thing
Service Workers are a thing
There is a library for building neural nets in JS: Synaptic
I want to learn Elm
Flora Power Mate is so much better than Club Mate (i.e. it actually tastes like mate)!
Talk notes
These are the unedited notes I jotted down during the talks. Mistakes, omissions, and misunderstandings are totally possible! Don’t take my word for anything; when in doubt check out the slides!
HTTP/2
Speaker: Ole Michaelis (@CodeStars, nesQuick on Github), from Jimdo
HTTP/1.1 has been in use since 1997
But it has some problems:
Lots of requests required to load a single page; “request bonanza”
Have to load the page itself, assets, ad stuff, tracking stuff….
Requests have to be done one-at-a-time, creating a “‘waterfall’ of blocked requests”
This causes latency (e.g. ~10 second load time for a web page like The Verge)
Especially problematic for mobile
You can get around it with weird hacks/workarounds, but these could violate best practices
Google made a thing called SPDY (“speedy”), which was sort of a predecessor to…
Single TCP connection, but multiple streams with requests running in parallel
Headers are compressed
Each browser can determine how to figure out/build the tree of dependencies
Firefox has the most efficient implementation at the moment
It sets up the dependency tree of requests before actually making any requests (?)
Sidenote: Huffman encoding
Take a string to compress
Count the frequencies of each character
Make a binary tree such that the leaf nodes are the characters arranged left-to-right from most frequent to least, and the leaves are connected through binary nodes from right to left, where each branch is labeled 0 on the left and 1 on the right
Use the path from the root of the tree to the character’s leaf node as the compression table
So the most frequent character will be 00, the least frequent will be e.g. 1111
This means more frequent characters have shorter compressions, so the overall compression will be as small as possible
HTTP/2 is already in use (22% of sites(???)) - you should start using it now!
Customers using HTTP/1.1 will experience an increase in load times, but those using updated browsers will see a decrease
Natural user interfaces using JS
Speaker: @princi_ya, from Zalando
Gesture-based interfaces, e.g. Intel RealSense 3D, Leap Motion
Some terminology:
Augmented Reality, also called Mediated Reality(?): real environment augmented with virtual components
Virtual Reality: totally simulated environment
Perceptual Computing: automatically perceiving what’s happening in the environment
Using JS/the browser to communicate with RealSense/Leap Motion SDK via WebSocket server and getUserMedia to access the user’s webcam
JS-Object Detect - open-source library for object detection from webcam
Unfortunately not very accurate - demo didn’t work
Elm: Web development with delight
Speaker: Bastian Krol (@bastiankrol), from codecentric
You can see the size of every build on treeherder using Perfherder.
Here’s how the APK size changed over the quarter, for mozilla-central Android 4.0 API15+ opt builds:
The dramatic decrease in February was caused by bug 1233799, which enabled the download content service and removed fonts from the APK.
For the same period, libxul.so generally increased in size:
The recent decrease in libxul was caused by bug 1259521, an upgrade of the Android NDK.
Memory
This quarter we began tracking some memory metrics, using test_awsy_lite.
These memory measurements are generally steady over the quarter, with some small improvements.
Autophone-Talos
This section tracks Perfherder graphs for mozilla-central builds of Firefox for Android, for Talos tests run on Autophone, on android-6-0-armv8-api15. The test names shown are those used on treeherder. See https://wiki.mozilla.org/Buildbot/Talos for background on Talos.
In previous quarters, these tests were running on Pandaboards; beginning this quarter, these tests run on actual phones via Autophone.
tsvgx
An svg-only number that measures SVG rendering performance. About half of the tests are animations or iterations of rendering. This ASAP test (tsvgx) iterates in unlimited frame-rate mode thus reflecting the maximum rendering throughput of each test. The reported value is the page load time, or, for animations/iterations – overall duration the sequence/animation took to complete. Lower values are better.
tp4m
Generic page load test. Lower values are better.
No significant improvements or regressions noted for tsvgx or tp4m.
Autophone
Throbber Start / Throbber Stop
These graphs are taken from http://phonedash.mozilla.org. Browser startup performance is measured on real phones (a variety of popular devices).
There was a lot of work on Autophone this quarter, with new devices added and old devices retired or re-purposed. These graphs show devices running mozilla-central builds, of which none were in continuous use over the quarter.
Throbber Start/Stop test regressions are tracked by bug 953342; a recent regression in throbber start is under investigation in bug 1259479.
mozbench
mozbench has been retired.
Long live arewefastyet.com! I’ll check in on arewefastyet.com next quarter.
Today is the last day of Q1 2016 which means time to review what I have done during all those last weeks. When I checked my status reports it’s kinda lot, so I will shorten it a bit and only talk about the really important changes.
Build System / Mozharness
After I had to dig into mozharness to get support for Firefox UI Tests during last quarter I have seen that more work had to be done to fully support tests which utilize Nightly or Release builds of Firefox.
The most challenging work for me (because I never did a build system patch so far) was indeed prefixing the test_packages.json file which gets uploaded next to any nightly build to archive.mozilla.org. This work was necessary because without the prefix the file was always overwritten by later build uploads. Means when trying to get the test archives for OS X and Linux always the Windows ones were returned. Due to binary incompatibilities between those platforms this situation caused complete bustage. No-one noticed that until now because any other testsuite is run on a checkin basis and doesn’t have to rely on the nightly build folders on archive.mozilla.org. For Taskcluster this wasn’t a problem.
In regards of firefox-ui-tests I was finally able to get a test task added to Taskcluster which will execute our firefox-ui-tests for each check-in and this in e10s and non-e10s mode. Due to current Taskcluster limitations this only runs for Linux64 debug, but that already helps a lot and I hope that we can increase platform coverage soon. If you are interested in the results you can have a look at Treeherder.
Other Mozharness specific changes are the following ones:
Fix to always copy the log files to the upload folder even in case of early aborts, e.g. failed downloads (bug 1230150)
Refactoring of download_unzip() method to allow support of ZipFile and TarFile instead of external commands (bug 1237706)
Removing hard requirement for the –symbols-url parameter to let mozcrash analyze the crash. This was possible because the minidump_stackwalk binary can automatically detect the appropriate symbols for nightly and release builds (bug 1243684)
Firefox UI Tests
The biggest change for us this quarter was the move of the Firefox UI tests from our external Github repository to mozilla-central. It means that our test code including the harness and Firefox Puppeteer is in sync with changes to Firefox now and regressions caused by ui changes should be very seldom. And with the Taskcluster task as mentioned above it’s even easier to spot those regressors on mozilla-inbound.
The move itself was easy but keeping backward compatibility with mozmill-ci and other Firefox branches down to mozilla-esr38 was a lot of work. To achieve that I first had to convert all three different modules (harness, puppeteer, tests) to individual Python packages. Those got landed for Firefox 46.0 on mozilla-central and then backported to Firefox 45.0 which also became our new ESR release. Due to backport complexity for older branches I decided to not land packages for Firefox 44.0, 43.0, and 38ESR. Instead those branches got smaller updates for the harness so that they had full support for our latest mozharness script on mozilla-central. Yes, in case you wonder all branches used mozharness from mozilla-central at this time. It was easier to do, and I finally switched to branch specific mozharness scripts later in mozmill-ci once Firefox 45.0 and its ESR release were out.
Adding mach support for Firefox UI Tests on mozilla-central was the next step to assist in running our tests. Required arguments from before are now magically selected by mach, and that allowed me to remove the firefox-ui-test dependency on firefox_harness, which was always a thorn in our eyes. As final result I was even able to completely remove the firefox-ui-test package, so that we are now free in moving our tests to any place in the tree!
In case you want to know more about our tests please check out our new documentation on MDN which can be found here:
Lots of changes have been done to this project to accommodate the Jenkins jobs to all the Firefox UI Tests modifications. Especially that I needed a generic solution which works for all existing Firefox versions. The first real task was to no longer use the firefox-ui-tests Github repository to grab the tests from, but instead let mozharness download the appropriate test package as produced and uploaded with builds to archive.mozilla.org.
It was all fine immediately for en-US builds given that the location of the test_packages.json file is distributed along with the Mozilla Pulse build notification. But it’s not the case for l10n builds and funsize update notifications. For those we have to utilize mozdownload to fetch the correct URL based on the version, platform, and build id. So all fine. A special situation came up for update tests which actually use two different Firefox builds. If we get the tests for the pre build, how can we magically switch the tests for the target version? Given that there is no easy way I decided to always use the tests from the target version, and in case of UI changes we have to keep backward compatibility code in our tests and Firefox Puppeteer. This is maybe the most ideal solution for us.
Another issue I had to solve with test packages was with release candidate builds. For those builds Release Engineering is not uploading nor creating any test archive. So a connection had to be made between candidate builds and CI (tinderbox) builds. As turned out the two properties which helped here are the revision and the branch. With them I at least know the changeset of the mozilla-beta, mozilla-release, and mozilla-esr* branches as used to trigger the release build process. But sadly that’s only a tag and no builds nor tests are getting created. Means something more is necessary. After some investigation I found out that Treeherder and its Rest API can be of help. Using the known tag and walking back the parents until Treeherder reports a successful build for the given platform, allowed me to retrieve the next possible revision to be used with mozdownload to retrieve the test_packages.json URL. I know its not perfect but satisfies us enough for now.
Then the release promotion project as worked on by the Release Engineering team was close to be activated. I heard a couple of days before, that Firefox 46.0b1 will be the first candidate to get it tested on. It gave me basically no time for testing at all. Thanks to all the support from Rail Aliiev I was able to get the new Mozilla Pulse listener created to handle appropriate release promotion build notifications. Given that with release promotion we create the candidates based on a signed off CI build we already have a valid revision to be used with mozdownload to retrieve the test_packages.json file – so no need for the above mentioned Treeherder traversal code. \o/ Once all has been implemented Firefox 46.0b3 was the first beta release for which we were able to process the release promotion notifications.
At the same time with release promotion news I also got informed by Robert Kaiser that the ondemand update jobs as performed with Mozmill do not work anymore. As turned out a change in the JS engine caused the bustage for Firefox 46.0b1. Given that Mozmill is dead I was not going to update it again. Instead I converted the ondemand update jobs to make use of Firefox-UI-Tests. This went pretty well, also because we were running those tests already for a while on mozilla-central and mozilla-aurora for nightly builds. As result we were able to run update jobs a day later for Firefox 46.0b1 and noticed that nearly all locales on Windows were busted, so only en-US got finally shipped. Not sure if that would have been that visible with Mozmill.
I already have plans what’s next. But given that I will be away from work for a full month now, I will have to revisit those once I’m back in May. I promise that I will also blog about them around that time.
when a comment is left on a review in review board/mozreview it is currently displayed as a small square in the left column.
our top reviewers have strongly indicated that this is suboptimal and would prefer to match what most other code review systems do in displaying comments as an inline block on the diff. i agree — review comments are important and deserve more attention in the user interface; they should be impossible to miss.
while the upstream review board team have long said that the current display is in need of fixing, there is minimal love for the inline comments approach.
recently we worked on a plan of attack to appease both our reviewers and upstream’s requirements. :smacleod, :mconley and i talked through a wide assortment of design goals and potential issues. we have a design document and i’ve started mocking up the approach in html:
we also kicked off discussions with the upstream review board development team, and are hopeful that this is a feature that will be accepted upstream.
As Firefox for Android drops support for ancient versions of Android, I find my collection of test phones becoming less and less relevant. For instance, I have a Galaxy S that works fine but only runs Android 2.2.1 (API 8), and I have a Galaxy Nexus that runs Android 4.0.1 (API 14). I cannot run current builds of Firefox for Android on either phone, and, perhaps because I rooted them or otherwise messed around with them in the distant past, neither phone will upgrade to a newer version of Android.
I have been letting these phones gather dust while I test on emulators, but I recently needed a real phone and managed to breathe new life into the Galaxy Nexus using an AOSP build. I wanted all the development bells and whistles and a root shell, so I made a full-eng build and I updated the Galaxy Nexus to Android 4.3 (api 18) — good enough for Firefox for Android, at least for a while!
mkdir aosp
cd aosp
repo init -u https://android.googlesource.com/platform/manifest -b android-4.3_r1 # Galaxy Nexus
repo sync (this can take several hours)
# Download all binaries from the relevant section of
#   https://developers.google.com/android/nexus/drivers .
# I used "Galaxy Nexus (GSM/HSPA+) binaries for Android 4.3 (JWR66Y)".
# Extract each (6x) downloaded archive, extracting into <aosp>.
# Execute each (6x) .sh and accept prompts, populating <aosp>/vendor.
source build/envsetup.sh
lunch full_maguro-eng
# use update-alternatives to select Java 6; I needed all 5 of these
sudo update-alternatives --config java
sudo update-alternatives --config javac
sudo update-alternatives --config javah
sudo update-alternatives --config javadoc
sudo update-alternatives --config javap
make -j4 (this can take a couple of hours)
Once make completes, I had binaries in <aosp>/out/… I put the phone in bootloader mode (hold down Volume Up + Volume Down + Power to boot Galaxy Nexus), connected it by USB and executed “fastboot -w flashall”.
Actually, in my case, fastboot could not see the connected device, unless I ran it from root. In the root account, I didn’t have the right settings, so I needed to do something like:
If you are following along, don’t forget to undo your java update-alternatives when you are done!
It took some time to download and build, but the procedure was fairly straight-forward and the results excellent: I feel like I have a new phone, perfectly clean and functional — and rooted!
(I have had no similar luck with the Galaxy S: AOSP binaries are only supplied for Nexus devices, and I see no AOSP instructions for the Galaxy S. Maybe it’s time to recycle this one.)
TaskCluster is a new-ish continuous integration system made at Mozilla. It manages the scheduling and execution of tasks based on a graph of their dependencies. It’s a general CI tool, and could be used for any kind of job, not just Mozilla things.
However, the example I describe here refers to a Mozilla-centric use case of TaskCluster1: tasks are run per check-in on the branches of Mozilla’s Mercurial repository and then results are posted to Treeherder. For now, the tasks can be configured to run in Docker images (Linux), but other platforms are in the works2.
So, I want to schedule a task! I need to add a new task to the task graph that’s created for each revision submitted to hg.mozilla.org. (This is part of my work on deploying a suite of tests for the Marionette Python test runner, i.e. testing the test harness itself.)
mozilla-taskcluster operates based on the info under testing/taskcluster/tasks in Mozilla’s source tree, where there are yaml files that describe tasks. Specific tasks can inherit common configuration options from base yaml files.
The yaml files are organized into two main categories of tasks: builds and tests. This is just a convention in mozilla-taskcluster about how to group task configurations; TC itself doesn’t actually know or care whether a task is a build or a test.
The task I’m creating doesn’t quite fit into either category: it runs harness tests that just exercise the Python runner code in marionette_client, so I only need a source checkout, not a Firefox build. I’d like these tests to run quickly without having to wait around for a build. Another example of such a task is the recently-created ESLint task.
Scheduling a task
Just adding a yaml file that describes your new task under testing/taskcluster/tasks isn’t enough to get it scheduled: you must also add it to the list of tasks in base_jobs.yml, and define an identifier for your task in base_job_flags.yml. This identifier is used in base_jobs.yml, and also by people who want to run your task when pushing to try.
How does scheduling work? First a decision task generates a task graph, which describes all the tasks and their relationships. More precisely, it looks at base_jobs.yml and other yaml files in testing/taskcluster/tasks and spits out a json artifact, graph.json3. Then, graph.json gets sent to TC’s createTask endpoint, which takes care of the actual scheduling.
In the excerpt below, you can see a task definition with a requires field and you can recognize a lot of fields that are in common with the ‘task’ section of the yaml files under testing/taskcluster/tasks/.
{"tasks":[{"requires":[// id of a build task that this task depends on"fZ42HVdDQ-KFFycr9PxptA"],"task":{"taskId":"c2VD_eCgQyeUDVOjsmQZSg""extra":{"treeherder":{"groupName":"Reftest","groupSymbol":"tc-R",},},"metadata":{"description":"Reftest test run 1","name":"[TC] Reftest",//...]}
For now at least, a major assumption in the task-graph creation process seems to be that test tasks can depend on build tasks and build tasks don’t really4 depend on anything. So:
If you want your tasks to run for every push to a Mozilla hg branch, add it to the list of builds in base_jobs.yml.
If you want your task to run after certain build tasks succeed, add it to the list of tests in base_jobs.yml and specify which build tasks it depends on.
Other than the above, I don’t see any way to specify a dependency between task A and task B in testing/taskcluster/tasks.
So, I added marionette-harness under builds. Recall, my task isn’t a build task, but it doesn’t depend on a build, so it’s not a test, so I’ll treat it like a build.
# in base_job_flags.ymlbuilds:# ...-marionette-harness# in base_jobs.ymlbuilds:# ...marionette-harness:platforms:-Linux64types:opt:task:tasks/tests/harness_marionette.yml
This will allow me to trigger my task with the following try syntax: try: -b o -p marionette-harness. Cool.
Make your task do stuff
Now I have to add some stuff to tasks/tests/harness_marionette.yml. Many of my choices here are based on the work done for the ESLint task. I created a base task called harness_test.yml by mostly copying bits and pieces from the basic build task, build.yml and making a few small changes. The actual task, harness_marionette.yml inherits from harness_test.yml and defines specifics like Treeherder symbols and the command to run.
The command
The heart of the task is in task.payload.command. You could chain a bunch of shell commands together directly in this field of the yaml file, but it’s better not to. Instead, it’s common to call a TaskCluster-friendly shell script that’s available in your task’s environment. For example, the desktop-test docker image has a script called test.sh through which you can call the mozharness script for your tests. There’s a similar build.sh script on desktop-build. Both of these scripts depend on environment variables set elsewhere in your task definition, or in the Docker image used by your task. The environment might also provide utilities like tc-vcs, which is used for checking out source code.
My task’s payload.command should be moved into a custom shell script, but for now it just chains together the source checkout and a call to mach. It’s not terrible of me to use mach in this case because I expect my task to work in a build environment, but most tests would likely call mozharness.
Configuring the task’s environment
Where should the task run? What resources should it have access to? This was probably the hardest piece for me to figure out.
docker-worker
My task will run in a docker image using a docker-worker5. The image, called desktop-build, is defined in-tree under testing/docker. There are many other images defined there, but I only considered desktop-build versus desktop-test. I opted for desktop-build because desktop-test seems to contain mozharness-related stuff that I don’t need for now.
The image is stored as an artifact of another TC task, which makes it a ‘task-image’. Which artifact? The default is public/image.tar. Which task do I find the image in? The magic incantation '{{#task_id_for_image}}desktop-build{{/task_id_for_image}}' somehow6 obtains the correct ID, and if I look at a particular run of my task, the above snippet does indeed get populated with an actual taskId.
"image":{"path":"public/image.tar",// Mystery task that makes a desktop-build image for us. Thanks, mystery task!"taskId":"aqt_YdmkTvugYB5b-OvvJw","type":"task-image"}
# in harness_test.ymlscopes:# Nearly all of our build tasks use tc-vcs-'docker-worker:cache:level-{{level}}-{{project}}-tc-vcs'cache:# The taskcluster-vcs tooling stores the large clone caches in this# directory and will reuse them for new requests this saves about 20s~# and is the most generic cache possible.level-{{level}}-{{project}}-tc-vcs:'/home/worker/.tc-vcs'
Routes allow your task to be looked up in the task index. This isn’t necessary in my case so I just omitted routes altogether.
Scopes are permissions for your tasks, and I just copied the scope that is used for checking out source code.
workerType is a configuration for managing the workers that run tasks. To me, this was a choice between b2gtest and b2gbuild, which aren’t specific to b2g anyway. b2gtest is more lightweight, I hear, which suits my harness-test task fine.
I had to include a few dummy values under extra in harness_test.yml, like build_name, just because they are expected in build tasks. I don’t use these values for anything, but my task fails to run if I don’t include them.
Yay for trial and error
If you have syntax errors in your yaml, the Decision task will fail. If this happens during a try push, look under Job Details > Inspect Task to fine useful error messages.
Iterating on your task is pretty easy. Aside from pushing to try, you can run tasks locally using vagrant and you can build a task graph locally as well with mach taskcluster-graph.
Resources
Blog posts from other TaskCluster users at Mozilla:
Thanks to dustin, pmoore and others for corrections and feedback.
This is accomplished in part thanks to mozilla-taskcluster, a service that links Mozilla’s hg repo to TaskCluster and creates each decision task. More at TaskCluster at Mozilla↩
To look at a graph.json artifact, go to Treeherder, click a green ‘D’ job, then Job details > Inspect Task, where you should find a list of artifacts. ↩
It’s not really true that build tasks don’t depend on anything. Any task that uses a task-image depends on the task that creates the image. I’m sorry for saying ‘task’ five times in every sentence, by the way. ↩
{{#task_id_for_image}} is an example of a predefined variable that we can use in our TC yaml files. Where do they come from? How do they get populated? I don’t know. ↩
As promised in my last blog posts I don’t want to only blog about the goals from last quarters, but also about planned work and what’s currently in progress. So this post will be the first one which will shed some light into my active work.
First lets get started with my goals for this quarter.
Execute firefox-ui-tests in TaskCluster
Now that our tests are located in mozilla-central, mozilla-aurora, and mozilla-beta we want to see them run on a check-in basis including try. Usually you will setup Buildbot jobs to get your wanted tasks running. But given that the build system will be moved to Taskcluster in the next couple of months, we decided to start directly with the new CI infrastructure.
So how will this look like and how will mozmill-ci cope with that? For the latter I can say that we don’t want to run more tests as we do right now. This is mostly due to our limited infrastructure I have to maintain myself. Having the needs to run firefox-ui-tests for each check-in on all platforms and even for try pushes, would mean that we totally exceed the machine capacity. Therefore we continue to use mozmill-ci for now to test nightly and release builds for en-US but also a couple of other locales. This might change later this year when mozmill-ci can be replaced by running all the tasks in Taskcluster.
Anyway, for now my job is to get the firefox-ui-tests running in Taskcluster once a build task has been finished. Although that this can only be done for Linux right now it shouldn’t matter that much given that nothing in our firefox-puppeteer package is platform dependent so far. Expanding testing to other platforms should be trivial later on. For now the primary goal is to see test results of our tests in Treeherder and letting developers know what needs to be changed if e.g. UI changes are causing a regression for us.
If you are interested in more details have a look at bug 1237550.
Documentation of firefox-ui-tests and mozmill-ci
We are submitting our test results to Treeherder for a while and are pretty stable. But the jobs are still listed as Tier-3 and are not taking care of by sheriffs. To reach the Tier-2 level we definitely need proper documentation for our firefox-ui-tests, and especially mozmill-ci. In case of test failures or build bustage the sheriffs have to know what’s necessary to do.
Now that the dust caused by all the refactoring and moving the firefox-ui-tests to hg.mozilla.org settles a bit, we want to start to work more with contributors again. To allow an easy contribution I will create various project documentation which will show how to get started, and how to submit patches. Ultimately I want to see a quarter of contribution project for our firefox-ui-tests around mid this year. Lets see how this goes…
More details about that can be found on bug 1237552.
Bug 1233220 added a new Android-only mochitest-chrome test called test_awsy_lite.html. Inspired by https://www.areweslimyet.com/mobile/, test_awsy_lite runs similar code and takes similar measurements to areweslimyet.com, but runs as a simple mochitest and reports results to Perfherder.
There are some interesting trade-offs to this approach to performance testing, compared to running a custom harness like areweslimyet.com or Talos.
+ Tests can be run locally to reproduce and debug test failures or irregularities.
+ There’s no special hardware to maintain. This is a big win compared to ad-hoc systems that might fail because someone kicks the phone hanging off the laptop that’s been tucked under their desk, or because of network changes, or failing hardware. areweslimyet.com/mobile was plagued by problems like this and hasn’t produced results in over a year.
? Your new mochitest is automatically run on every push…unless the test job is coalesced or optimized away by SETA.
? Results are tracked in Perfherder. I am a big fan of Perfherder and think it has a solid UI that works for a variety of data (APK sizes, build times, Talos results). I expect Perfherder will accommodate test_awsy_lite data too, but some comparisons may be less convenient to view in Perfherder compared to a custom UI, like areweslimyet.com.
– For Android, mochitests are run only on Android emulators, running on aws. That may not be representative of performance on real phones — but I’m hoping memory use is similar on emulators.
– Tests cannot run for too long. Some Talos and other performance tests run many iterations or pause for long periods of time, resulting in run-times of 20 minutes or more. Generally, a mochitest should not run for that long and will probably cause some sort of timeout if it does.
For test_awsy_lite.html, I took a few short-cuts, worth noting:
test_awsy_lite only reports “Resident memory” (RSS); other measurements like “Explicit memory” should be easy to add;
test_awsy_lite loads fewer pages than areweslimyet.com/mobile, to keep run-time manageable; it runs in about 10 minutes, using about 6.5 minutes for page loads.
Results are in Perfherder. Add data for “android-2-3-armv7-api9” or “android-4-3-armv7-api15” and you will see various tests named “Resident Memory …”, each corresponding to a traditional areweslimyet.com measurement.
New mozregression releases, coming with great new features!
Changes for both GUI and command line:
Avoid unnecessary downloads by reusing persistent builds (bug 1160078).
Builds that are “near” the ones we want in bisection will be used by default
now, instead of downloading the accurate build. In case you want to deactivate
this behavior, you can use the command line flag “–approx-policy=none”, or
see in the “Global preferences” view in the GUI. You can also add “approx-policy = none”
in your config file.
Print the url of the bug that contain the changes that probably caused the regression
(bug 1239699).
add support for running builds from the try branch (bug 1240033).
Fixed a bug that prevented empty profile dirs to be used (bug 1233686).
GUI changes only:
Fixed a regression that prevented to run a build after a user cancel (bug 1240393).
Fixed a crash when the builds were too old to contain metadata (bug 1239993).
Fixed the issue that minimized the log view on Windows (bug 1219887).
Command line changes only:
Check good and bad builds prior to start the bisection (bug 1233896).
This is an important change, now mozregression will by default make you
test the first and last builds of a range before starting the bisection. The idea
is to be sure that what you think is good and bad really is. Note that you can
deactivate it by using the command line flag “–mode=no-first-check”, or by adding
“mode = no-first-check” in your config file.
Allow to run a single b2g build with --launch (no associated bug).
Hello from Engineering Productivity! Once a month we highlight one of our projects to help the Mozilla community discover a useful tool or an interesting contribution opportunity.
This month’s project is mozregression!
Why is mozregression useful ?
mozregression helps to find regressions in Mozilla projects like Firefox or Firefox on Android. It downloads and runs the builds between two dates (or changesets) known to be good and bad, and lets you test each build to finally find by bisection the smallest possible range of changesets where the regression appears.
It does not build locally the application under test, instead, it uses pre-built files, making it fast and easy for everyone to look for the origin of a regression.
Examples:
# Search a Firefox regression in mozilla-central starting from 2016-01-01
mozregression -g 2016-01-01
# Firefox regression, on mozilla-aurora from 2015-09-01 to 2015-10-01
b2g bisection flow support (b2g devices regression hunting)
Contributions
William Lachance (:wlach) and myself (:parkouss) are the current maintainers of mozregression.
We welcome contributors! Mike Ling is helping the project for quite some time now, adding useful features and fixing various bugs – he’s currently working on providing ready to use binaries for Mac OS X. A big thanks Mike Ling for your contributions!
Also thanks to Saurabh Singhal and Wasif Hider, who are recent contributors on the graphical user interface.
If you want to contribute as a developer or help us on the documentation, please say hi on the #ateam irc channel!
Reporting bugs / new ideas
You can also help a lot by reporting bugs or new ideas! Please file bugs on bugzilla with the mozregression component:
For more information about all Engineering Productivity projects visit our wiki. If you’re interested in helping out, the A-Team bootcamp has resources for getting started.
The last quarter of 2015 is gone and its time to reflect what happened in Q4. In the following you will find a full overview again for the whole quarter. It will be the last time that I will do that. From now on I will post in shorter intervals to specific topics instead of covering everything. This was actually a wish from our latest automation survey which I want to implement now. I hope you will like it.
So during the last quarter my focus was completely on getting our firefox-ui-tests moved into mozilla-central, and to use mozharness to execute firefox-ui-tests in mozmill-ci via the test archive. As result I had lesser time for any other project. So lets give some details…
Firefox UI Tests / Mozharness
One thing you really want to have with tests located in the tree is that those are not failing. So I spent a good amount of time to fix our top failures and all those regressions as caused by UI changes (like the security center) in Firefox as preparation for the move. I got them all green and try my best to keep that state now while we are in the transition.
The next thing was to clean-up the repository and split apart all the different sub folders into their own package. With that others could e.g. depend on our firefox-puppeteer package for their own tests. The whole work of refactoring has been done on bug 1232967. If you wonder why this bug is not closed yet it’s because we still have to wait with the landing of the patch until mozmill-ci production uses the new mozharness code. This will hopefully happen soon and only wait of some other bugs to be fixed.
But based on those created packages we were able to use exactly that code to get our harness, puppeteer, and tests landed on http://hg.mozilla.org/mozilla-central. We also package them into the common.tests.zip archive for use in mozmill-ci. Details about all that can be found on bug 1212609. But please be aware that we still use the Github repository as integration repository. I regularly mirror the code to hg, which has to happen until we can also use the test package for localized builds and update tests.
Beside all that there were also a couple of mozharness fixes necessary. So I implemented a better fetching of the tooltool script, added the uninstall feature, and also setup the handling of crash symbols for firefox-ui-tests. Finally the addition of test package support finished up my work on mozharness for Q4 in 2015.
During all the time I was also sheriffing our test results on Treeherder (e.g. mozilla-central) because we are still Tier-3 level and sheriffs don’t care about it.
Mozmill CI
Our Jenkins based CI system is still called mozmill-ci even it doesn’t really run any mozmill tests anymore. We decided to not change its name given that it will only be around this year until we can run all of our tests in TaskCluster. But lots of changes have been landed, which I want to announce below:
We followed Release Engineering and got rid of the OS X 10.8 testing. That means the used Mac minis were ready to get re-imaged with OS X 10.11. The transition worked seamlessly.
Enhancements for test report submission to Treeherder by switching over to Hawk credentials and more understandable group names and symbols.
Preparation of all the machines of our supported platforms (OSX: 10.6, 10.9, 10.10, 10.11 / Ubuntu: 14.04 / Windows: XP, 7, 8.1) to be able to handle mozharness driven tests.
Thanks to the tireless efforts from Szabolcs Hubai we got Memchaser working again in latest Firefox builds.
So all in all it was a productive quarter with lots of things accomplished. I’m glad that we got all of this done. Now in Q1 it will continue and more interesting work is in-front of me, which I’m excited about. I will announce that soon in my next blog post.
Until then I would like to give a little more insight into our current core team for Firefox automation. A picture taken during our all hands work week in Orlando early in December shows Syd, Maja, myself, and David:
Lets get started into 2016 with lots of ideas, discussions, and enough energy to get those things done.
As promised in my last post about the automation survey results I wanted to come up with a follow-up to clarify our next steps in being more open for our activities, discussions, and also quarterly goals. Sorry, that it has been taken a bit longer but end of the quarter and especially the year is mostly packed with stuff to finish up. Also the all-hands work week in Orlando beginning of December hold me off from doing a lot real work.
So lets get started with the mailing list topic first. As we have seen most people kinda like to get our news via the automation mailing list. But given the low usage of that list in the last months it was a bit surprising. Nearly all the time I sent emails myself (not to count in Travis results). That means we want to implement a change here. From now on we won’t use the mozilla.dev.automation list but instead utilize the mozilla.tools list. Also because this is the recommended list for the Engineering Productivity team we are all part of, and discussions will reach a larger audience. So please subscribe to this list via Google Groups or Email.
For status updates about our current activities we started to use standu.ps last quarter. It seems to work pretty well for us and everyone else is welcome to also post updates to our automation project section. If you are interested in those updates then read through that list or simply subscribe the page in your RSS reader.
Please also note that from now on there will be no Firefox Automation reports anymore. Instead I will reduce the amount of different contents, and only write about projects I worked on. So keep an eye out to not miss those!
Firefox is a great browser. One of the reasons I really love it is because it is highly configurable: as an Emacs user, I wanted to use emacs key bindings inside Firefox – well, it’s easy to do that. And much more!
Most of the magic for me comes from the awesome keysnail addon. It basically convert Firefox into Emacs, is also highly configurable and have plugins.
For example, I now use C-x <left> and C-x <right> to switch tabs; C-x b to choose a specific tab (using the Tanything plugin) or C-x k to kill a tab. Tabs are now like Emacs buffers! Keysnail support the mark, incremental search (C-s and C-r), specific functions, … Even M-x is implemented, to search and run specific commands!
Also I use the Find As You Type Firefox feature, for links. It’s awesome: I just hit ‘, then start typing some letters in a link title that I want to follow – I can then use C-s or C-r to find next/previous matching links if needed, then I just press Return to follow the link.
I can browse the web more efficiently, I am less using the mouse and I can reuse the same key bindings in Emacs and Firefox! I keep my configuration files on github, feel free to look at it if you’re interested!
For the past couple of months I have been working on integrating
Try Extender with
Treeherder.
The goal was to add an “Add new jobs” button to Treeherder that would
display every possible job for that push. Users would then be able to
click on the jobs they want to trigger them.
It was a fun project in which I had a lot of help from the Treeherder
team and I ended up learning a little about how TH works.
How Treeherder shows jobs
For every push, Treeherder makes a request to its API to obtain a
JSON object with every job for that push and their respective
symbols, status, types, platforms and whatever else is needed to
correctly display them. Every single one of these jobs has an id and
it’s in a row in Treeherder’s job database.
Buildbot jobs enter TH’s job database as part of the
ETL layer.
Celery tasks
parse JSON files that are generated every minute by BuildAPI.
Runnable jobs database
Treeherder already knows how to get a list of jobs from an API
endpoint and display them in the right places (if you are curious,
mapResultSetJobs
carries most of the weight). All I needed to do was add a new API
endpoint with the list of every possible job (and the associated
information).
To feed the information to the new endpoint, I created a table of
runnable jobs. Jobs enter this new table through a daily task
that downloads and processes
allthethings.json.
Setting things up
With the database part ready, some things had to be done on the UI
side. An (extremely reasonable) assumption made by Treeherder is that
it will only show jobs that exist. Since runnable jobs don’t exist,
I had to create a new type of job button that would not open the
information panel and that would allow users to click on several jobs
at the same time.
The triggering part was done by sending Pulse messages to
Pulse Actions,
which would then schedule jobs using mozci and releng’s amazing
BuildBot Bridge (armenzg
did a great job adding BBB support to mozci).
Possible improvements
The UX is not very intuitive.
Selecting several jobs is very annoying. One idea to fix that is
to have a keyboard shortcut to “select all visible jobs”, so users
could use the search box to filter only the jobs they wanted
(e.g. “e10s”) and select everything that is showing.
Known problems
Since the triggering part happens in Pulse Actions and the selecting
part happens in Treeherder, we don’t tell users what happened with
their requests. Until
bug 1032163
lands, only the push author and people with an “@mozilla.com” email
address will be able to extend pushes. Right now we have no way of
telling users that their request was denied.
We can schedule test jobs when no build job exists, and we can trigger
test jobs when the build job is already completed. But when the build
job is currently running/pending, we don’t trigger anything. We could
either trigger an additional build job or do nothing, and we choose to
do nothing to avoid triggering costly unnecessary build jobs.
What about TaskCluster jobs?
Currently “Add new jobs” only supports triggering Buildbot jobs. What
is needed to support TaskCluster jobs? 2 things:
Having TC jobs in the runnable jobs database.
Having a supporting tool that is able to trigger arbitrary TC jobs.
If anyone is interested in working on this, please ping me (I’m adusca
on IRC), or we can talk more about it in Mozlando ;)
After mozregression 2.0, it is time for the GUI to follow!
0.6.0 GUI release is based on the changes from mozregression 2.0: the bisection
flow is now updated, and starting a bisection should be a lot easier since it
does not ask anymore for a nightly or inbound bisection kind - simply choose
an application, possibly a branch and some options (build type, bits) then
choose the regression range based on dates, release numbers, build ids or
raw changesets.
That’s all. :)
All in all, a great simplification of the interface and more power. Give it
a try!
November 23rd I blogged about the active survey covering the information flow inside our Firefox Automation team. This survey was open until November 30th and I thank everyone of the participants which have taken the time to get it filled out. In the following you can find the results:
Most of the contributors who are following our activities are with Mozilla for the last 3 years. Whereby half of them joined less than a year ago. There is also a 1:1 split between volunteers and paid staff members. This is most likely because of the low number of responses, but anyway increasing the number of volunteers is certainly something we want to follow-up on in the next months.
The question about which communication channel is preferred to get the latest news got answered with 78% for the automation mailing list. I feel that this is a strange result given that we haven’t really used that list for active discussions or similar in the past months. But that means we should put more focus on the list. Beside that also 55% listening our activities on Bugzilla via component watchers. I would assume that those people are mostly our paid staff who kinda have to follow each others work regarding reviews, needinfo requests, and process updates. 44% of all read our blog posts on the Mozilla A-Team Planet. So we will put more focus in the future to both blog posts and discussions on the mailing list.
More than half of our followers check for updates at least once a day. So when we get started with interesting discussions I would expect good activity throughout the day.
44% of all feel less informed about our current activities. Another 33% answered this question with ‘Mostly’. So it’s a clear indication what I already thought and which clearly needs action on our side to be more communicative. Doing this might also bring more people into our active projects, so mentoring would be much more valuable and time-effective as handling any drive-by projects which we cannot fully support.
A request for the type of news we should do more is definitely for latest changes and code landings from contributors. This will ensure people feel recognized and contributors will also know each others work, and see the effectiveness in regards of our project goals. But also discussions about various automation related topics (as mentioned already above) are highly wanted. Other topics like quarterly goals and current status updates are also wanted and we will see how we can do that. We might be able to fold those general updates into the Engineering Productivity updates which are pushed out twice a month via the A-Team Planet.
Also there is a bit of confusion about the Firefox Automation team and how it relates to the Engineering Productivity team (formerly A-Team). Effectively we are all part of the latter, and the “virtual” Automation team has only been created when we got shifted between the A-Team and QA-Team forth and back. This will not happen anymore, so we agreed on to get rid of this name.
All in all there are some topics which will need further discussions. I will follow-up with another blog post soon which will show off our plans for improvements and how we want to work to make it happen.
Now mozregression will automatically detect a merge commit, and switch to bisect
in the branch where the merged commits comes from. So mozilla-inbound is no
longer the default for Firefox when bisecting by date is done, since there is no
default now.
Based on that, we have been able to simplify the overall usage of mozregression:
removed the --inbound-branch option. Just use --repo now when you
want to specify a branch, no matter if it is an integration or a release
branch.
allowed to bisect using dates on an integration branch
removed the --good-rev, --bad-rev, --good-release and
--bad-release options. Just use --good and --bad for everything
now, being a date, a changeset, a release number or a build id.
added some aliases for the branch names: you can use m-i, inbound or
mozilla-inbound to describe the same branch - another example, m-c,
central and mozilla-central are equivalent.
mozregression is smarter to let you test builds with a specific flavor, e.g.
debug builds.
Those changes adds some new possibilities to bisect which were not available
before, like bisecting using changesets on mozilla-central, only specify
a good changeset (the bad changeset will be implied, and will be the most
recent one).
Some examples:
# bisect using dates
mozregression -g 2015-11-20 -b 2015-11-25  # implied branch is m-c
mozregression -g 2015-11-20 -b 2015-11-25 --repo inbound
# bisect using changesets
mozregression -g dcd5230c4ce1 -b 931721112d8e  # implied branch is m-i
mozregression -g 1b2e15608f34 -b abbd213422a5 --repo m-c
# use debug builds
mozregression -g 2015-11-20 -b 2015-11-25 -B debug
mozregression -g dcd5230c4ce1 -b 931721112d8e -B debug
# of course, --launch works the same way now
mozregression --launch abbd213422a5 --repo m-c
mozregression --launch 2015-11-25 --repo m-i -B debug
Just keep in mind that when you use a changeset, the default branch will be the
default integration branch for the application instead of the release branch.
For firefox, mozilla-inbound will be the default when you use a changeset,
and mozilla-central will be used otherwise. This is historical and
we may change that in the future - for now just keep that in mind, or
always specify a branch to be sure.
Within the Firefox Automation team we were suffering a bit in sharing information about our work over the last couple of months. That mainly happened because I was alone and not able to blog more often than once in a quarter. The same applies to our dev-automation mailing list which mostly only received emails from Travis CI with testing results.
Given that the team has been increased to 4 people now (beside me this is Maja Frydrychowicz, Syd Polk, and David Burns, we want to be more open again and also trying to get more people involved into our projects. To ensure that we do not make use of the wrong communication channels – depending where most of our readers are – I have setup a little survey. It will only take you a minute to go through but it will help us a lot to know more about the preferences of our automation geeks. So please take that little time and help us.
The survey can be found here and is open until end of November 2015:
I am currently investigating how we can make mozregression smarter to handle merges, and I will explain how in this post.
Problem
While bisecting builds with mozregression on mozilla-central, we often end up with a merge commit. These commits often incorporate many individual changes, consider for example this url for a merge commit. A regression will be hard to find inside such a large range of commits.
How mozregression currently works
Once we reach a one day range by bisecting mozilla-central or a release branch, we keep the most recent commit tested, and we use that for the end of a new range to bisect mozilla-inbound (or another integration branch, depending on the application) The beginning of that mozilla-inbound range is determined by one commit found 4 days preceding the date of the push of the commit (date pushed on mozilla-central) to be sure we won’t miss any commit in mozilla-central.
But there are multiple problems. First, it is not always the case that the offending commit really comes from m-i. It could be from any other integration branch (fx-team, b2g-inbound, etc). Second, bisecting over a 4 days range in mozilla-inbound may involve testing a lot of builds, with some that are useless to test.
Another approach
How can we improve this ? As just stated, there are two points that can be improved:
do not automatically bisect on mozilla-inbound when we finished mozilla-central or a release branch bisection. Merges can comes from fx-team, or another integration branch and this is not really application dependent.
try to avoid going back 4 days before the merge when going to the integration branch, there is a loss in productivity since we are likely to test commits that we already tested.
So, how can this be achieved ? Here is my current approach (technical):
Once we are done with the nightlies (one build per day) from a bisection from m-c or any release branch, switch to use taskcluster to download possible builds between. This way we reduce the range to two pushes (one good, one bad) instead of a full day. But since we tested them both, only the commits in the most recent push may contain the regression.
Read the commit message of the top most commit in the most recent push. If it does not looks like a merge commit, then we can’t do anything (maybe this is not a merge, then we are done).
We have a merge push. So now we try to find the exact commits around, on the branch where the merged commits come from.
Bisect this new push range using the changesets and the branch found above, reduce that range and go to 2.
Let’s take an example:
mozregression -g 2015-09-20 -b 2015-10-10
We are bisecting firefox, on mozilla-central. Let’s say we end up with a range 2015-10-01 – 2015-10-02. This is how the pushlog will looks like at the end, 4 pushes and more than 250 changesets.
Now mozregression will automatically reduce the range (still on mozilla-central) by asking you good/bad for those remaining pushes. So, we would end up with two pushes – one we know is good because we tested the top most commit, and the other we know is bad for the same reason. Look at the following pushlog, showing what is still untested (except for the merge commit itself) – 96 commits, coming from m-i.
And then mozregression will detect that it is a merge push from m-i, so automatically it will let you bisect this range of pushes from m-i. That is, our 96 changesets from m-c now converted to testable pushes in m-i. And we will end with a smaller range, for example this one where it will be easy to find our regression because this is one push without any merge.
Comparison
Note that both methods for the example above would have worked. Mainly because we are ending in commits originated from m-i. I tried with another bisection, this time trying to find a commit in fx-team – in that case, current mozregression is simply out – but with the new method it was handled well.
Also using the current method, it would have required around 7 steps after reducing to the one day range for the example above. The new approach can achieve the same with around 5 steps.
Last but not least, this new flow is much more cleaner:
start to bisect from a given branch. Reduce the range to one push on that branch.
if we found a merge, find the branch, the new pushes, and go to 1 to bisect some more with this new data. Else we are done.
Is this applicable ?
Well, it relies on two things. The first one (and we already rely on that a bit currently) is that a merged commit can be found in the branch where it comes from, using the changeset. I have to ask vcs gurus to know if that is reliable, but from my tests this is working well.
Second thing it that we need to detect a merge commit – and from which branch commits comes from. Thanks to the consistency of the sheriffs in their commit messages, this is easy.
Even if it is not applicable everywhere for some reason, it appears that it often works. Using this technique would result in a more accurate and helpful bisection, with speed gain and increased chances to find the root cause of a regression.
This need some more thinking and testing, to determine the limits (what if this doesn’t work ? Should we/can we use the old method in that case ?) but this is definitely something I will explore more to improve the usefulness of mozregression.
It’s the first week of November, and because of the December all-hands and the end-of-year holidays, this essentially means the quarter is half over. You can see what the team is up to and how we’re tracking against our deliverables with this spreadsheet.
Autoland has been enabled for the version-control-tools repo and is being dogfooded by the team. We hope to have it turned on for landings to mozilla-inbound within a couple of weeks.
Treeherder: the team is in London this week working on the automatic starring project. They should be rolling out an experimental UI soon for feedback from sheriffs and others. armenzg has fixed several issues with automatic backfilling so it should be more useful.
Perfherder: wlach has blogged about recent improvements to Perfherder, including the ability to track the size of the Firefox installer.
Developer Workflows: gbrown has enabled |mach run| to work with Android.
TaskCluster Support: the mochitest-gl job on linux64-debug is now running in TaskCluster side-by-side with buildbot. Work is ongoing to green up other suites in TaskCluster. A few other problems (like failure to upload structured logs) need to be fixed before we can turn off the corresponding buildbot jobs and make the TaskCluster jobs “official”.
e10s Support: we are planning to turn on e10s tests on Windows 7 as they are greened up; the first job which will be added is the e10s version of mochitest-gl, and the next is likely mochitest-devtools-chrome. To help mitigate capacity impacts, we’ve turned off Windows XP tests by default on try in order to allow us to move some machines from the Windows XP pool to the Windows 7 pool, and some machines have already been moved from the Linux 64 pool (which only runs Talos and Android x86 tests) to the Windows 7 pool. Combined with some changes recently made by Releng, Windows wait times are currently not problematic.
WebDriver: ato, jgraham and dburns recently went to Japan to attend W3C TPAC to discuss the WebDriver specification. They will be extending the charter of the working group to get it through to CR. This will mean certain parts of the specification need to finished as soon as possible to start getting feedback.
The Details
hg.mozilla.org
Better error messages during SSH failures (bug 1217964)
Make pushlog compatible with Mercurial 3.6 (bug 1217569)
Support Mercurial 3.6 clone bundles feature on hg.mozilla.org (bug 1216216)
Functionality from bundleclone extension that Mozilla wrote and deployed is now a feature in Mercurial itself!
Advertise clone bundles feature to 3.6+ clients that don’t have it enabled (bug 1217155)
Update the bundleclone extension to seamlessly integrate with now built-in clone bundles feature
MozReview/Autoland
We’ve enabled Autoland to “Inbound” for the version-control-tools repository and are dogfooding it while working on UI and workflow improvements.
Following up on some discussion around “squashed diffs”, an explanatory note has been added to the parent (squashed) review requests, which serves to distinguish them from, and to promote, review requests for individual commits.
“Complete Diff” has been renamed to the more accurate “Squashed Diff”. The “Review Summary” link has been removed, but you can still get to the squashed-diff reviews via the squashed diff itself—but note that we’ll likely be removing support for squashed-diff reviews in order to promote the practices of splitting up large commits into smaller, standalone ones and reviewing each individually.
A patch to track the files review status is now under review; it should land in the next few days.
Mobile Automation
[gbrown] ‘mach run’ now supports Firefox for Android
[bc] Helping out with Autophone Talos, mozdevice adb*.py maintenance
Firefox and Media Automation
[maja_zf] Marionette test runner is now a litte more flexible and extensible: I’ve added some features needed by Firefox UI and Update tests that are useful to all desktop tests. (Bug 1212608)
ActiveData
[ekyle] Buildbot JSON logs are imported, along with all text logs they point to: we should now have a complete picture of the time spent on all steps by all machines on all pools. Still verifying the data though.
bugzilla.mozilla.org
(bug 1213757) delegate password and 2fa resets to servicedesk
(bug 1218457) Allow localconfig to override (force) certain data/params values (needed for AWS)
(bug 1219750) Allow Apache2::SizeLimit to be configured via params
(bug 1177911) Determine and implement better password requirements for BMO
(bug 1196743) – Fix information disclosure vulnerability that allows attacker to obtain victim’s GitHub OAuth return code
We (ato, AutomatedTester, jgraham) went to Japan to W3C TPAC to discuss the WebDriver specification. We will be extending the charter of the working group to get it through to CR. This will mean certain parts of the specification need to finished as soon as possible to start getting feedback.
There are a lot of good altruistic reasons to contribute to Open Source Software, but this post focuses on my selfish reasons.
Learning Projects
I’m OK at reading books, implementing examples and doing exercises, but when it comes to thinking about good projects to get my hands dirty and implement stuff, I had a lot of trouble thinking of stuff to do. OSS provides an endless supply of bugs, projects and features to work on.
Code Reviews
Before I got started on OSS, the only person who ever really read my code was myself. Every patch I submitted to Mozilla was reviewed by at least one person, and that really improved my code. From running a Python linter plugin in Emacs to learning idiomatic ways of writing expressions, I learned a lot of good habits.
Mentoring
Whenever I was working on a bug, I could ask for help and someone would always answer, no matter if it was a problem specific to a bug or a general language/module/tool question. This way I was able to accomplish things that were unimaginable to me before.
Users
Knowing someone is using a feature/tool I wrote is an amazing feeling. Even bug reports make me happy! I cherish every IRC mention of my projects.
Experience
Before I got started with OSS, all of my programming experience came from books and small projects. Contributing to OSS I got a chance to work on larger codebases, work with other people and play with technologies that I wouldn’t get to play by myself.
Community
I’m now part of a very friendly community, full of people that I respect, like and trust. They help me a lot, and sometimes I even get to help back!
Confidence
I used to be very afraid of not being good enough to contribute to OSS. I was not sure I was a real programmer. There were several bugs that I was completely sure I would not be able to fix, until I fixed them. Now I look back at what I did and I feel proud. I feel like maybe I really am a programmer.
If you are interested in long-term contributing, the A-team has some pretty cool contribution opportunities on the next quarter of contribution. Check it out!
able to work with preview releases of Android - bug 1185787
And a few bugfixes also:
results of Nightly-bisection not showing the dates anymore - Bug 1176708
not all options are shown in the resume info - Bug 1176100
Thanks to Mikeling for being really active on some bugs here!
There is also a basic support for firefox os builds (flame, aries, simulator).
Lots of work still needs to be done to make it really useful, (see bug 1205560)
but it is now possible to bisect between dates or changesets on a given
branch: mozregression will download the builds and ask you to flash it on
the device.
# Regression finding by date range with aries-opt builds (defaults to b2g-inbound)
mozregression --app b2g-aries --bad 2015-09-10 --good 2015-09-07
# Regression finding on mozilla-inbound for debug builds
mozregression --app b2g-aries --build-type debug --bad 2015-09-10 --good 2015-09-07 \--inbound-branch mozilla-inbound
# Flame builds with a good and bad revision
mozregression --app b2g-flame --bad-rev c4bf8c0c2044 --good-rev b93dd434b3cd
# find more information
mozregression --help
mozregression --list-build-types
Thanks to Michael Shal, Naoki Hirata and others for helping me on this.
for the next couple of quarters (at least) i’ll be shifting my attention full time from bugzilla to mozreview. this switch involves a change of language, frameworks, and of course teams. i’m looking forward to new challenges.
one of the first things i’ve done is sketch out a high level architectural diagram of mozreview and its prime dependencies:
mozreview exists as an extension to reviewboard, using bugzilla for user authentication, ldap to check commit levels, with autoland pushing commits automatically to try (and to mozilla-central soon). there’s mecurial extensions on both the client and server to make pushing things easer, and there are plans to perform static analysis with bots.
It’s Q4, and at Mozilla that means it’s planning season. There’s a lot of work happening to define a Vision, Strategy and Roadmap for all of the projects that Engineering Productivity is working on; I’ll share progress on that over the next couple of updates.
Higlights
Build System: Work is starting on a comprehensive revamp of the build system, which should make it modern, fast, and flexible. A few bits of this are underway (like migration of remaining Makefiles to moz.build); more substantial progress is being planned for Q1 and the rest of 2016.
Bugzilla: Duo 2FA support is coming soon! The necessary Bugzilla changes has landed, we’re just waiting for some licensing details to be sorted out.
Treeherder: Improvements have been made to the way that sheriffs can backfill jobs in order to bisect a regression. Meanwhile, lots of work continues on backend and frontend support for automatic starring.
Perfherder and Performance Testing: Some optimizations were made to Perfherder which has made it more performant – no one wants a slow performance monitoring dashboard! jmaher and bc are getting close to being able to run Talos on real devices via Autophone; some experimental runs are already showing up on Treeherder.
MozReview and Autoland: It’s no longer necessary to have an LDAP account in order to push commits to MozReview; all that’s needed is a Bugzilla account. This opens the door to contributors using the system. Testing of Autoland is underway on MozReview’s dev instance – expect it to be available in production soon.
TaskCluster Migration: OSX cross-compiled builds are now running in TaskCluster and appearing in Treeherder as Tier-2 jobs, for debug and static checking. The TC static checking build with likely become the official build soon (and the buildbot build retired); the debug build won’t become official until work is done to enable existing test jobs to consume the TC build.
Work is progressing on enabling TaskCluster test jobs for linux64-debug; our goal is to have these all running side-by-side the buildbot jobs this quarter, so we can compare failure rates before turning off the corresponding buildbot jobs in Q1. Moving these jobs to TaskCluster enables us to chunk them to a much greater degree, which will offer some additional flexibility in automation and improve end-to-end times for these tests significantly.
Mobile Automation: All Android test suites that show in Treeherder can now be run easily using mach.
Dev Workflow: It’s now easier to create new web-platform-tests, thanks to a new |mach web-platform-tests-create| command.
e10s Support: web-platform-tests are now running in e10s mode on linux and OSX platforms. We want to turn these and other tests in e10s mode on for Windows, but have hardware capacity problems. Discussions are underway on how to resolve this in the short-term; longer-term plans include an increase in hardware capacity.
Test Harnesses: run-by-dir is now applied to all mochitest jobs on desktop. This improves test isolation and paves the way for chunking changes which we will use to improve end-to-end times and make bisection turnaround faster. Structured logging has been rolled out to Android reftests; Firefox OS reftests still to come.
ActiveData: Work is in progress to build out a model of our test jobs running in CI, so that we can identify pieces of job setup and teardown which are too slow and targets of possible optimization, and so that we can begin to predict the effects of changes to jobs and hardware capacities.
hg.mozilla.org: Mercurial 3.6 will have built-in support for seeding clones from pre-generated bundle files, and will have improved performance for cloning, especially on Windows.
Autoland code has been reviewed and committed; testing is underway on our dev instance.
TaskCluster Support
Landed all patches for cross-mac builds, running fine on inbound/central!
[ahal] Got some linux64 tests running (various flavours of mochitest, reftest and xpcshell), though not yet green.
Mobile Automation
[gbrown] mach reftest|crashtest|jstestbrowser now supports Firefox for Android (all Android test suites run on treeherder can now be run from mach)
Dev Workflow
[jgraham] Added a |mach web-platform-tests-create| target to help with the workflow of creating new web-platform-tests.
Firefox and Media Automation
Netflix bandwidth limiting tests blocked because of a problem on Netflix side.
Web platform media-source directory no longer being run on our Jenkins since all platforms of web platform tests now run as part of release.
We’ve established a roadmap that coordinates moving ui-tests and media-tests in-tree, updating the Marionette test runner and moving media jobs into mozmill-ci
General Automation
[jgraham] web-platform-tests-e10s now running across all trees on Mac/Linux (Windows has capacity problems)
SETA updated to support new android debug tests
run-by-dir is enabled for all desktop mochitests.
[ahal] reftest structured logging working on desktop and android (b2g still left to do)
ActiveData
Continuous importing of all known test text logs. These detail the various builder steps, and mozharness steps and their timings, and can be found in the `jobs.action.timings` table. There is still more to do to clean up the data.
It’s time for another Firefox Automation report! It’s incredible how fast a quarter passes by without that I have time to write reports more often. Hopefully it will change soon – news will be posted in a follow-up blog post.
Ok, so what happened last quarter for our projects.
Mozharness
One of my deliverables in Q3 was to create mozharness scripts for our various tests in the firefox-ui-tests repository, so that our custom runner scripts can be replaced. This gives us a way more stable system and additional features like crash report handling, which are necessary to reach the tier 2 level in Treeherder.
After some refactoring of the firefox ui tests, scripts for the functional and update tests were needed. But before those could be implemented I had to spent some time in refactoring some modules of mozharness to make them better configurable for non-buildbot jobs. All that worked pretty fine and finally the entry scripts have been written. Something special for them is that they even have different customers, so extra configuration files had to be placed. In detail it’s us who run the tests in Jenkins for nightly builds, and partly for release builds. On the other side Release Engineering want to run our update tests on their own hardware when releases have to be tested.
By the end of September all work has been finished. If you are interested in more details feel free to check the tracking bug 1192369.
Mozmill-CI
Our Jenkins instance got lots of updates for various new features and necessary changes. All in all I pushed 27 commits which affected 53 files.
Here a list of the major changes:
Refactoring of the test jobs has been started so that those can be used for mozharness driven firefox-ui-tests later in Q4. The work has not been finished and will be continued in Q4. Especially the refactoring for report submission to Treeherder even for aborted builds will be a large change.
A lot of time had to be spent in fixing the update tests for all the changes which were coming in with the Funsize project of Release Engineering. Due to missing properties in the Mozilla Pulse messages update tests could no longer be triggered for nightly builds. Therefore the handling of Pulse messages has been completely rewritten to allow the handling of similar Pulse messages as sent out from TaskCluster. That work was actually not planned and has been stolen me quite some time from other projects.
A separation of functional and remote tests didn’t make that much sense. Especially because both types are actually functional tests. As result they have been merged together into the functional tests. You can still run remote tests only by using --tag remote; similar for tests with local testcases by using `–tag local.
We stopped running tests for mozilla-esr31 builds due to Firefox ESR31 is no longer supported.
To lower the amount of machines we have to maintain and to getting closer what’s being run on Buildbot, we stopped running tests on Ubuntu 14.10. Means we only run on Ubuntu LTS releases from now on. Also we stopped tests for OS X 10.8. The nodes will be re-used for OS X 10.11 once released.
We experienced Java crashes due to low memory conditions of our Jenkins production master again. This was kinda critical because the server is not getting restarted automatically. After some investigation I assumed that the problem is due to the 32bit architecture of the VM. Given that it has 8GB of memory a 64bit version of Ubuntu should have been better used. So we replaced the machine and so far everything looks fine.
Totally surprising we had to release once more a bugfix release of Mozmill. This time the framework didn’t work at all due to the enforcement of add-on signing. So Mozmill 2.0.10.2 has been released.
We’ve said good-bye to Q3, and are moving on to Q4. Planning for Q4 goals and deliverables is well underway; I’ll post a link to the final versions next update.
Last week, a group of 8-10 people from Engineering Productivity gathered in Toronto to discuss approaches to several aspects of developer workflow. You can look at the notes we took; next up is articulating a formal Vision and Roadmap for 2016, which incorporates both this work as well as other planning which is ongoing separately for things like MozReview and Treeherder.
Highlights
Bugzilla: Support for 2FA has been enhanced.
Treeherder:
The automatic starring backend, along with related database changes, is now in production. In Q4 we’ll be developing a simple UI for this, and by the end of quarter, automatic starring for at least simple failures should be a reality.
Job Ingestion via Pulse Exchanges is in the final review stages. This will allow projects like Task Cluster to send JSON Schema-validated job data to Treeherder via a Pulse Exchange, rather than our APIs. It also enables developers and testers the ability to ingest production jobs from Task Cluster to their local machine. Blog post: https://cheshirecam.wordpress.com/2015/09/30/treeherder-loading-data-from-pulse/
:Goma’s line highlighting and linking in the log viewer are now live. See this blog post for details.
Jonathan French, our awesome contractor and contributor, has landed onscreen shortcuts; see this blog post. Jonathan will be moving on to other things soon, and we’ll sorely miss him!
Perfherder and Performance Automation:
Work is underway to prototype a UI in Perfherder which can be used for performance sheriffing sans Alert Manager or Graphserver; follow bug 1201154 for more details. Separately, work has been started to allow other performance harnesses (besides Talos) submit data to Perfherder; bug 1175295.
Talos on linux32 has been turned off; the machines that had been used for this are being repurposed as Windows 7 and Windows 8 test workers, in order to reduce overall wait times on those platforms.
The dromaeo DOM Talos test has been enabled on linux64.
MozReview and Autoland: mcote posted a blog post detailing some of the rough edges in MozReview, and explaining how the team intends on tackling these. dminor blogged about the state of autoland; in short, we’re getting close to rolling out an initial implementation which will work similarly to the current “checkin-needed” mechanism, except, of course, it will be entirely automated. May you never have to worry about closed trees again!
Mobile Automation: gbrown made some additional improvements to mach commands on Android; bc has been busy with a lot of Autophone fixes and enhancements.
Firefox Automation: maja_zf has enabled MSE playback tests on trunk, running per-commit. They will go live at the next buildbot reconfig.
Developer Workflow: numerous enhancements have been made to |mach try|; see list below in the Details section. run-by-dir has been applied to mochitest-plain on most platforms, and to mochitest-chrome-opt, by kaustabh93, one of team’s contributors. This reduces test bleedthrough, a source of intermittent failures, as well as improves our ability to change job chunking without breaking tests.
Build System: gps has improved test package generation, which results in significantly faster builds – a savings of about 5 minutes per build on OSX and Windows in automation; about 90s on linux.
[camd] Job Ingestion via Pulse Exchanges is in the final review stages. This will allow projects like Task Cluster to send JSON Schema-validated job data to Treeherder via a Pulse Exchange, rather than our APIs. It also enables developers and testers the ability to ingest production jobs from Task Cluster to their local machine. Blog post: https://cheshirecam.wordpress.com/2015/09/30/treeherder-loading-data-from-pulse/
[jgraham] Landed new |mach try| implementation that passes test paths rather than manifest paths; this adds support for web-platform-tests in |mach try|
[jgraham] Added support for saving and reusing try strings in |mach try|
[jgraham] Added Talos support to |mach try|
[jgraham] reftest and xpcshell test harnesses now take paths to multiple test locations on the command line and expose more functionality through mach
[jmaher] Kaustabh93 has runbydir live for mochitest-plain osx debug, and mochitest-chrome opt; All that is left is mochitest-chrome debug and linux64 ASAN e10s.
[ato] Support for running Marionette tests using `mach try` in review
ActiveData
[ekyle] Upgraded cluster to 1.7.1 (1.4.2 had known recovery issues)
Today we have released mozdownload 1.18 to PyPI. The reason why I think it’s worth a blog post is that with this version we finally added support for a sane API. With it available using the mozdownload code in your own script is getting much easier. So there is no need to instantiate a specific scraper anymore but a factory scraper is doing all the work depending on the options it gets.
Here some examples:
from mozdownload import FactoryScraper
scraper = FactoryScraper('release', version='40.0.3', locale='de')
scraper.download()
from mozdownload import FactoryScraper
scraper = FactoryScraper('candidate', version='41.0b9', platform='win32')
scraper.download()
from mozdownload import FactoryScraper
scraper = FactoryScraper('daily', branch='mozilla-aurora')
scraper.download()
If you are using mozdownload via its API you can also easily get the remote URL and the local filename:
Hereby the factory class is smart enough to only select those passed-in options which are appropriate for the type of scraper. If you have to download different types of builds you will enjoy that feature given that only the scraper type has to be changed and all other options could be still passed-in.
We hope that this new feature will help you by integrating mozdownload into your own project. There is no need anymore by using its command line interface through a subprocess call.
A lot of new things have been added in mozregression recently, and I think this deserve a blog post.
I released mozregression 1.0.0! Plenty of new cool stuff in there, the ability to launch a single build, to choose the build to test after a skipped build (allowing to go back faster in the good/bad perimeter) and other goodies. Well, just try it!
A new release for the GUI interface, 0.4.0! So here again, new cool features and a lot of bug fixes. For example, new releases are automatically checked so it will be easy to know when updates are available.
mozregression command line is now integrated as a mach command for mozilla developers! You can try “./mach mozregression -h”. I will probably send a mail on dev-platform about that.
Well, big thanks for MikeLing and Jonathan Pigree for their great work on those tools! They are an important part of the team, helping with discussions and patches. Oh, and also a big thanks to users who report bugs and make great proposals: Elbart, Ray Satiro, arni2033, Jukka Jylänki, and all others!
Sorry for the delay on GUI release and posts, but we were quite busy
with mozregression command line these days!
Still we don’t forget about the GUI. And now there are a bunch of great
new cool things with this 0.4.0 release!
quite a lot of bugfixes, I won’t enumerate them; :)
this is now possible to choose the next build to be tested after
a skip, thus allowing to be in the good-bad range again faster
(bug 1203852)
automatic check if new releases are available and inform the user
(bug 1177001)
we added a crash report dialog, that will show up on crashes, so you
will be able to help us fix the bug by reporting the internal error shown.
I hope you won’t see this often though! (bug 1202242)
As usual now, big thanks for MikeLing and Jonathan Pigree for their work
and time! They both have a really great impact on the software, from
decisions to implementations.
Bugzilla: The BMO has been busy implementing security enhancements, and as a result, BMO now supports two-factor authentication. Setting this up is easy through BMO’s Preferences page.
Treeherder: The size of the Treeherder database dropped from ~700G to around ~80G thanks to a bunch of improvements in the way we store data. Jonathan French is working on improvements to the Sheriff Panel. And Treeherder is now ingesting data that will be used to support Automatic Starring, a feature we expect to be live in Q4.
Perfherder and Performance: Will Lachance has published a roadmap for Perfherder, and has landed some changes that should improve Perfherder’s performance. Talos tests on OSX 10.10 have been hidden in Perfherder because the numbers are very noisy; the reason for this is not currently known. Meanwhile, Talos has finally landed in mozilla-central, which should make it easier to iterate on. Thanks to our contributor Julien Pagès for making this happen! Joel Maher has posted a Talos update on dev.platform with many more details.
MozReview and Autoland: The web UI now uses BMO API keys; this should make logins smoother and eliminate random logouts. Several UI improvements have been made; see full list in the “Details” section below.
Mobile Automation: Geoff Brown has landed the much-requested |mach android-emulator| command, which makes it much easier to run tests locally with an Android emulator. Meanwhile, we’re getting closer to moving the last Talos Android tests (currently running on panda boards) to Autophone.
Developer Workflow: Our summer intern, Vaibhav Agrawal, landed support for an initial version of |mach find-test-chunk|, which can tell you which chunk a test gets run in. This initial version supports desktop mochitest only. Vaibhav gave an intern presentation this week, “Increasing Productivity with Automation”. Check it out!
General Automation: James Graham has enabled web-platform-tests-e10s on try, but they’re hidden pending investigation of tests which are problematic with e10s enabled. Joel Maher and Kim Moir in Release Engineering have tweaked our SETA coalescing, so that lower prioritized jobs are run at least every 7th push, or every hour; further increasing the coalescing window will wait until we have better automatic backfililng in place. Meanwhile, the number of chunks of mochitest-browser-chrome has been increased from 3 to 7, with mochitest-devtools-chrome soon to follow. This will make backfilling faster, as well as improving turnaround times on our infrastructure.
hg.mozilla.org: The bzexport and bzpost extensions have been updated to support BMO API keys.
Bughunter: Our platform coverage now includes opt and debug builds of linux32, linux64, opt-asan-linux64, OSX 10.6, 10.8, 10.9, and windows7 32- and 64-bit.
The Details
bugzilla.mozilla.org
bug 1197073 – add support for 2fa using totp (eg. google authenticator)
Among other fixes and improvements, Logviewer UI more gracefully handles additional incomplete log states: unknown log steps (1193222) and expired jobs (1193222)
A new Help menu has been added with useful links for all users (1199078)
We are now storing the data required for the autostarring project. That means storing every single crash/test failure/log error line from the structured log (1182464).
Talos for autophone is getting closer, code checked in, just need to resolve reporting results and scheduling.
Dev Workflow
vaibhav1994 – A basic version of find-test-chunk has landed. This will help in determining on which chunk a particular test is present in production. It works for mochitest for desktop platforms, see various options with ‘./mach find-test-chunk’
vaibhav1994 – –rebuild-talos option now present in trigger-bot to trigger only talos jobs a certain number of times on try.
Firefox and Media Automation
sydpolk – Network bandwidth limiting tests have been written; working to deploy them to Jenkins.
sydpolk – Streamlined Jenkins project generation based on Jenkins python API (found out about this at the Jenkins conference last week)
sydpolk – Migration of hardware out of MTV2 QA lab won’t happen this quarter because Network Ops people are shutting down the Phoenix data center.
maja_zf – mozharness script for firefox-media-tests has been refactored into scripts for running the tests in buildbot and our Jenkins instance
General Automation
chmanchester – psutil 3.1.1 is now installed on all test slaves as a part of running desktop unit tests. This will help our test harnesses manages subprocesses of the browser, and particularly kill them to get stacks after a hang.
armenzg – Firefox UI tests can now be called through a python wrapper instead of only through a python binary. This is very important since it was causing Windows UAC prompts on Release Engineering’s Windows test machines. The tests now execute well on all test platforms.
jgraham – web-platform-tests-e10s now running on try, but still hidden pending some investigation of tests that are only unstable with e10s active
SETA work is ongoing to support new platforms, tests, and jobs.
ActiveData
[ekyle] Queries into nested documents pass tests, but do not scale on the large cluster; startup time is unacceptable. Moving work to separate thread for quick startup, with the hope a complicated query will not arrive until the metadata is finished collecting
[ekyle] Added auto-restart on ETL machines that simply stop working (using CloudWatch); probably caused by unexpected data, which must be looked into later.
[ekyle] SpotManager config change for r3.* instances
hg.mozilla.org
Add times for replication events on push
Reformat pushlog messages on push to be less eye bleedy
bzexport and bzpost extensions now support Bugzilla API Keys
WebDriver
[ato] Specified element interaction commands
[ato] New chapter on user prompts and modal handling
[ato] New chapter on screen capture
[ato] Cookies retrieval bug fixes
[ato] Review of normative dependencies
[ato] Security chapter review
Marionette
Wires 0.4 has been released.
[ato] Deployed Marionette protocol changes, bringing Marionette closer to the WebDriver standard
[ato] Assorted content space commands converted to use new dispatching technique
[jgraham] Updated wires for protocol changes
bughunter
Now running opt, debug tinderbox builds for Linux 32 bit, 64 bit; OSX 10.6, 10.8, 10.9; Windows 7 32 bit, 64 bit; opt asan tinderbox builds for Linux 64 bit.
bug 1180749 Sisyphus – Django 1.8.2 support
bug 1185497 Sisyphus – Bughunter – use ASAN builds for Linux 64 bit workers
bug 1192646 Sisyphus – Bughunter – use crashloader.py to upload urls to be resubmitted